
Toncoin rises 2.94% as price closes near session highs despite bearish oscillators

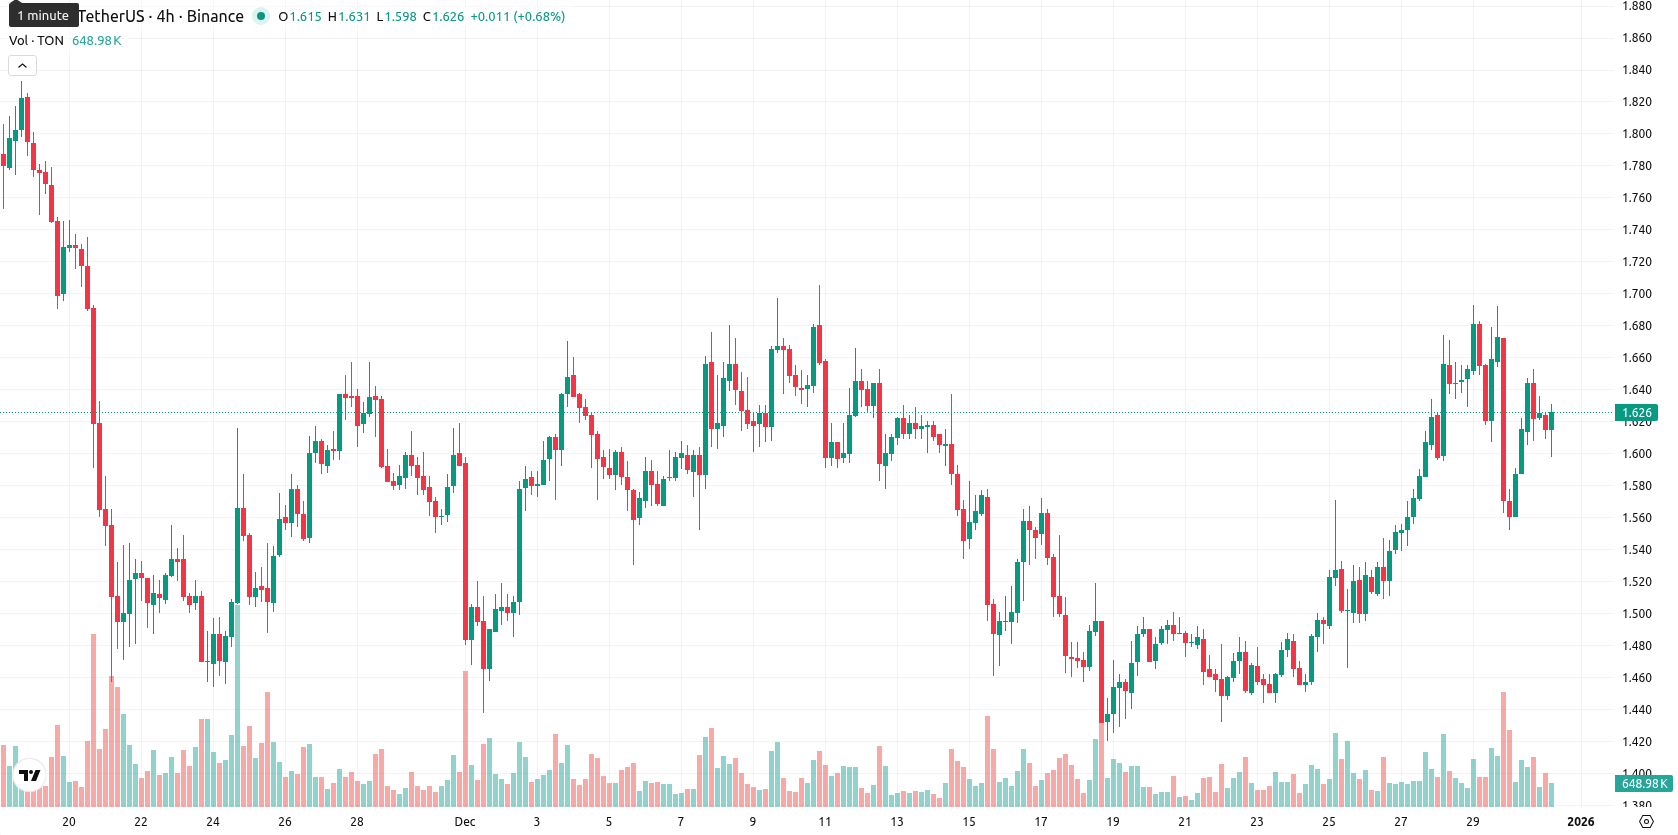
Toncoin (TON) is trading at $1.629, which is above both the MA-20 ($1.538) and MA-50 ($1.616), but remains well below the MA-200 ($2.569). This structure signals ongoing short- and medium-term bullish momentum, with the long-term trend still bearish.
Highlights
- TON trades at $1.629, above both the MA-20 ($1.538) and MA-50 ($1.616), but remains well below the MA-200 ($2.569), reinforcing a bearish long-term trend.
- Mixed momentum signals persist, as D1 MACD and ADX indicate bearish bias while RSI, CCI, and BBP show moderate buyer dominance and Stoch RSI indicates overbought conditions.
- For the next five trading days, the price is expected to remain in a flat $1.60–$1.64 corridor with under 20% probability of a significant breakout.
Mixed momentum readings challenge resistance as overbought signals emerge
Immediate dynamic support is around the Ichimoku Kijun ($1.561), and resistance could emerge near the MA-50 or the psychological $1.650 mark. Momentum readings are mixed: the D1 MACD and ADX both signal a bearish bias, yet the RSI, CCI, and BBP all indicate buyer dominance and only moderate strength, while the Stoch RSI notes overbought conditions. The Awesome Oscillator is neutral, and the price opened higher with no gap, currently holding at the top of today’s range, showing a 2.94% gain since the previous session. Intraday volatility is moderate, and the tone reflects persistent strength toward session highs, even as some oscillators signal caution due to overextension — there is clear divergence between bullish short-term oscillators and negative momentum readings.
Rangebound outlook persists as weekly indicators suggest waning upside
For the next five trading days, the expected range is $1.60 to $1.64, keeping well within 20% of the current price and consistent with typical volatility for TON. There is a very low probability (less than 20%) of a significant move higher, with a greater likelihood for mild declines or sideways action, given all main weekly indicators point to continued weakness. In the baseline scenario, price holds in a flat corridor between $1.60 and $1.64. A bullish breakout would require surging past $1.64, while a bearish scenario unfolds if the price dips below $1.60, with sellers regaining firm control.
Last time, analysts noted that Toncoin is exhibiting short-term support above its 20-day moving average but remains pressured by medium- and long-term resistance levels, with mixed technical indicators showing mild bullish oscillators against dominant bearish momentum signals. The outlook favors sideways consolidation within a narrow range, with limited upside potential unless key resistance is broken and downside risk persisting if support fails.


Latest TON News


-
 Afghanistan
-
 Albania
-
 Algeria
-
 Angola
-
 Argentina
-
 Armenia
-
 Australia
-
 Austria
-
 Azerbaijan
-
 Bahamas
-
 Bahrain
-
 Bangladesh
-
 Belarus
-
 Belgium
-
 Bolivia
-
 Botswana
-
 Brazil
-
 Brunei
-
 Bulgaria
-
 Cambodia
-
 Cameroon
-
 Canada
-
 Chile
Chile
-
 China
China
-
 Colombia
-
 Congo
Congo
-
 Costa Rica
-
 Cote d'Ivoire
-
 Croatia
-
 Cuba
Cuba
-
 Cyprus
-
 Czechia
-
 DR Congo
-
 Denmark
-
 Dominican Republic
-
 Ecuador
-
 Egypt
Egypt
-
 El Salvador
-
 Estonia
-
 Eswatini
-
 Ethiopia
-
 Finland
-
 France
-
 Georgia
-
 Germany
-
 Ghana
Ghana
-
 Greece
-
 Haiti
Haiti
-
 Hong Kong
-
 Hungary
-
 India
India
-
 Indonesia
-
 Iran, Islamic republic
-
 Iraq
Iraq
-
 Ireland
-
 Israel
-
 Italy
Italy
-
 Jamaica
-
 Japan
Japan
-
 Jordan
-
 Kazakhstan
-
 Kenya
Kenya
-
 Korea
Korea
-
 Kuwait
-
 Kyrgyzstan
-
 Laos
Laos
-
 Latvia
-
 Lebanon
-
 Lesotho
-
 Libya
Libya
-
 Lithuania
-
 Luxembourg
-
 Madagascar
-
 Malaysia
-
 Malta
Malta
-
 Mauritius
-
 Mexico
-
 Moldova
-
 Mongolia
-
 Montenegro
-
 Morocco
-
 Mozambique
-
 Myanmar
-
 Namibia
-
 Nepal
Nepal
-
 Netherlands
-
 New Zealand
-
 Nigeria
-
 North Macedonia
-
 Norway
-
 Oman
Oman
-
 Pakistan
-
 Palestine
-
 Panama
-
 Papua New Guinea
-
 Paraguay
-
 Peru
Peru
-
 Philippines
-
 Poland
-
 Portugal
-
 Puerto Rico
-
 Qatar
Qatar
-
 Reunion
-
 Romania
-
 Rwanda
-
 Saudi Arabia
-
 Serbia
-
 Singapore
-
 Slovakia
-
 Slovenia
-
 Somalia
-
 South Africa
-
 Spain
Spain
-
 Sri Lanka
-
 Sweden
-
 Switzerland
-
 Syria
Syria
-
 Taiwan
-
 Tajikistan
-
 Tanzania
-
 Thailand
-
 Trinidad and Tobago
-
 Tunisia
-
 Turkey
-
 UAE
UAE
-
 Uganda
-
 Ukraine
-
 United Kingdom
-
United States
-
 Uruguay
-
 Uzbekistan
-
 Venezuela
-
 Vietnam
-
 Yemen
Yemen
-
 Zambia
-
 Zimbabwe
- Forex
- Crypto
