
+4.16% for TRUMP — mixed signals with risk of reversal cap upside

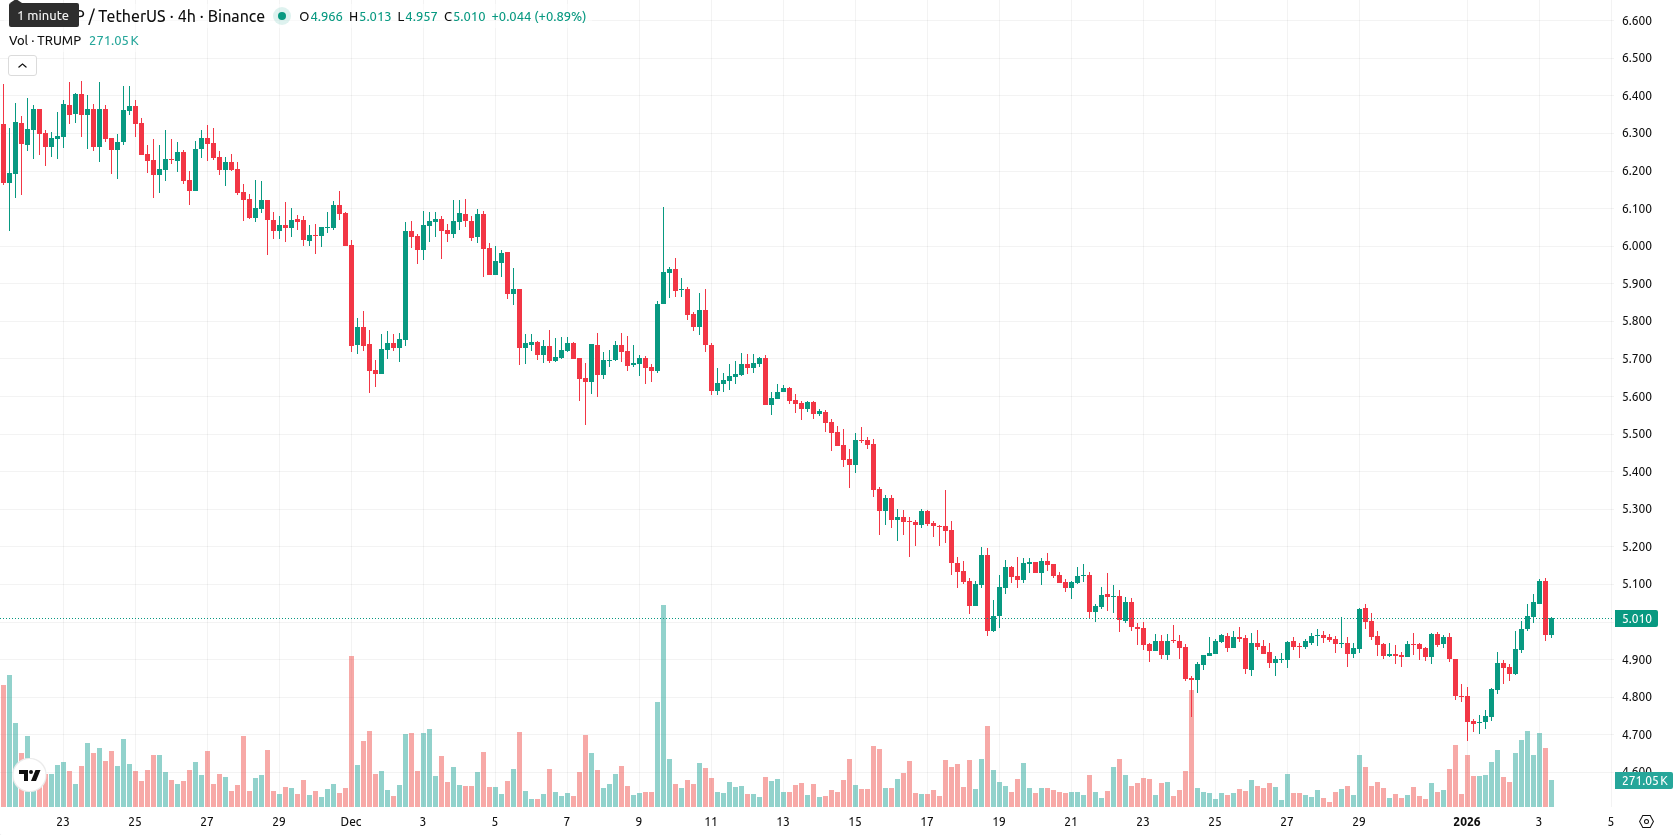
Official Trump (TRUMP) is trading at $5.08, slightly above its MA-20 ($5.03), but below MA-50 ($5.73) and MA-200 ($7.72), indicating a short-term bullish bias amid pressure from medium-term and long-term sellers.
Highlights
- TRUMP closed at $5.08, up 4.16% on the day, trading above its MA-20 ($5.03) but below MA-50 ($5.73) and MA-200 ($7.72).
- Momentum signals are conflicting: MACD and ADX indicate strong bearish or sell momentum, while intraday BBP is bullish and Stochastic RSI is overbought.
- Projected five-session range is $4.80 to $5.30, with less than 20% probability of further price increases and downside favored by weekly indicators.
Mixed momentum complicates outlook as technical levels converge
The technical setup highlights the Kijun level at $5.39 as the nearest dynamic support, with resistance at MA-50 ($5.73). Momentum signals are mixed: MACD and ADX both signal continued selling pressure, while BBP indicates buyers are currently in control intraday. Oscillators are divergent — RSI trends below 50, CCI is neutral, and Stochastic RSI shows overbought conditions, reflecting a complex short-term environment with persistent broader weakness.
Downside risk elevated as volatility band signals limited upside
Looking ahead, TRUMP is likely to trade within a volatility band from $4.80 to $5.30 over the next five sessions. The odds of further price gains are low, with a higher probability of downside movement due to consistent weekly bearish momentum. The most expected scenario is sideways action in this band; a move above $5.73 would signal a shift toward a bullish outlook, while a drop below $4.80 would confirm further weakness.
Previously it was reported that Official Trump remains under sustained bearish pressure, trading below all major moving averages, with momentum indicators such as MACD, ADX, and RSI confirming ongoing downside momentum despite some brief intraday buying strength. With limited support in the current range, resistance near the Ichimoku Kijun persists, and the price is expected to consolidate sideways unless a decisive breakout above resistance or below support occurs.


-
 Afghanistan
-
 Albania
-
 Algeria
-
 Angola
-
 Argentina
-
 Armenia
-
 Australia
-
 Austria
-
 Azerbaijan
-
 Bahamas
-
 Bahrain
-
 Bangladesh
-
 Belarus
-
 Belgium
-
 Bolivia
-
 Botswana
-
 Brazil
-
 Brunei
-
 Bulgaria
-
 Cambodia
-
 Cameroon
-
 Canada
-
 Chile
Chile
-
 China
China
-
 Colombia
-
 Congo
Congo
-
 Costa Rica
-
 Cote d'Ivoire
-
 Croatia
-
 Cuba
Cuba
-
 Cyprus
-
 Czechia
-
 DR Congo
-
 Denmark
-
 Dominican Republic
-
 Ecuador
-
 Egypt
Egypt
-
 El Salvador
-
 Estonia
-
 Eswatini
-
 Ethiopia
-
 Finland
-
 France
-
 Georgia
-
 Germany
-
 Ghana
Ghana
-
 Greece
-
 Haiti
Haiti
-
 Hong Kong
-
 Hungary
-
 India
India
-
 Indonesia
-
 Iran, Islamic republic
-
 Iraq
Iraq
-
 Ireland
-
 Israel
-
 Italy
Italy
-
 Jamaica
-
 Japan
Japan
-
 Jordan
-
 Kazakhstan
-
 Kenya
Kenya
-
 Korea
Korea
-
 Kuwait
-
 Kyrgyzstan
-
 Laos
Laos
-
 Latvia
-
 Lebanon
-
 Lesotho
-
 Libya
Libya
-
 Lithuania
-
 Luxembourg
-
 Madagascar
-
 Malaysia
-
 Malta
Malta
-
 Mauritius
-
 Mexico
-
 Moldova
-
 Mongolia
-
 Montenegro
-
 Morocco
-
 Mozambique
-
 Myanmar
-
 Namibia
-
 Nepal
Nepal
-
 Netherlands
-
 New Zealand
-
 Nigeria
-
 North Macedonia
-
 Norway
-
 Oman
Oman
-
 Pakistan
-
 Palestine
-
 Panama
-
 Papua New Guinea
-
 Paraguay
-
 Peru
Peru
-
 Philippines
-
 Poland
-
 Portugal
-
 Puerto Rico
-
 Qatar
Qatar
-
 Reunion
-
 Romania
-
 Rwanda
-
 Saudi Arabia
-
 Serbia
-
 Singapore
-
 Slovakia
-
 Slovenia
-
 Somalia
-
 South Africa
-
 Spain
Spain
-
 Sri Lanka
-
 Sweden
-
 Switzerland
-
 Syria
Syria
-
 Taiwan
-
 Tajikistan
-
 Tanzania
-
 Thailand
-
 Trinidad and Tobago
-
 Tunisia
-
 Turkey
-
 UAE
UAE
-
 Uganda
-
 Ukraine
-
 United Kingdom
-
United States
-
 Uruguay
-
 Uzbekistan
-
 Venezuela
-
 Vietnam
-
 Yemen
Yemen
-
 Zambia
-
 Zimbabwe
- Forex
- Crypto
