
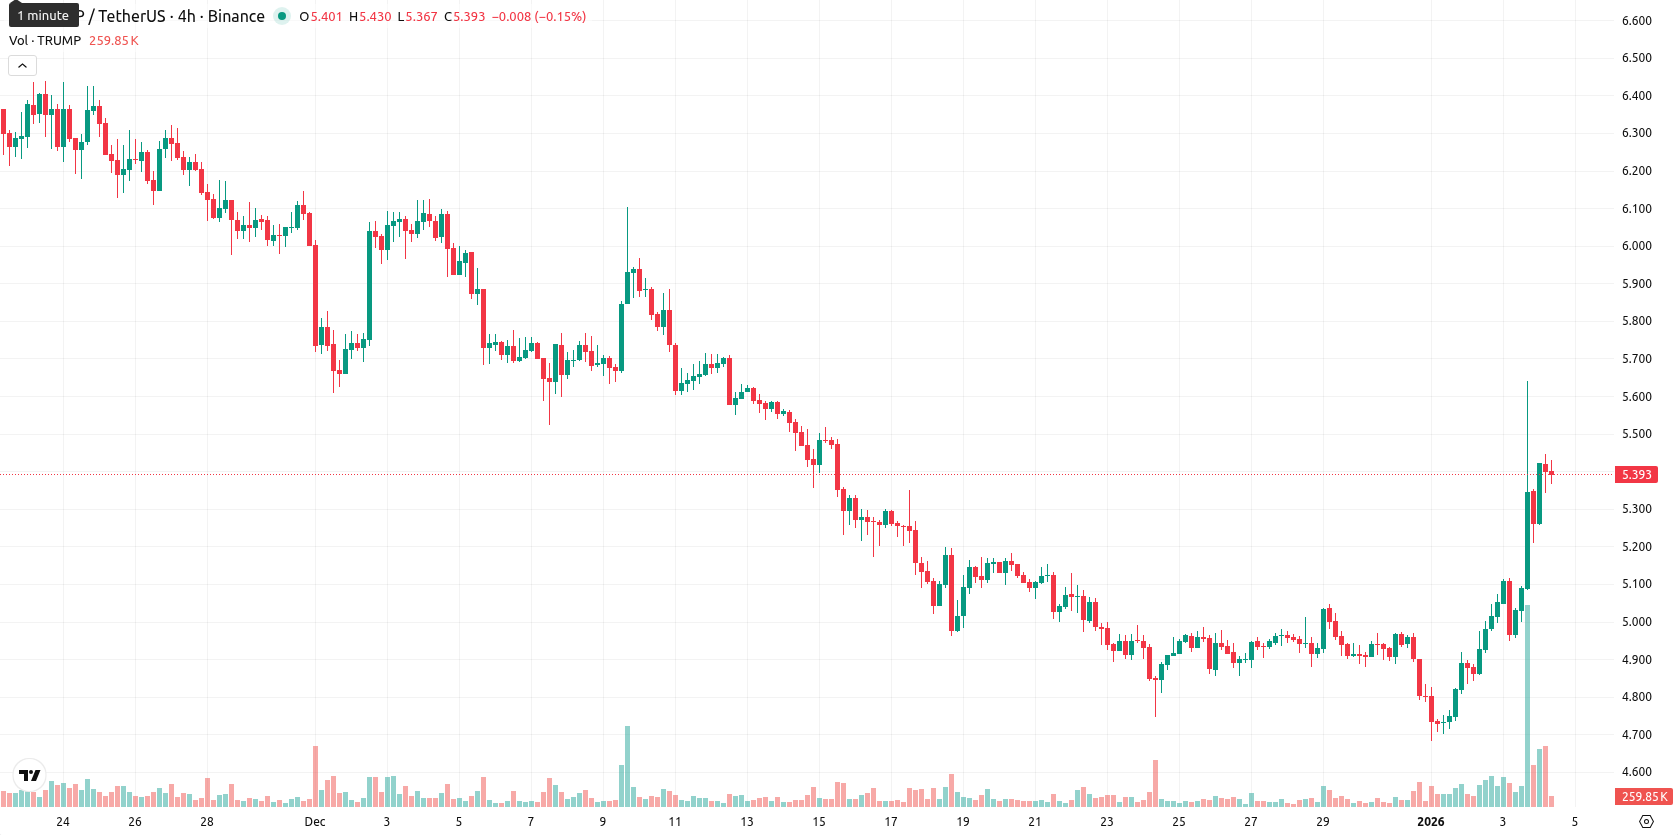
TRUMP rises 6.83% as intraday volatility fuels bullish action despite trend weakness

Official Trump (TRUMP) is trading at $5.41, above the MA-20 ($5.02) but below the MA-50 ($5.69) and well under the MA-200 ($7.70), indicating short-term bullishness with ongoing medium- and long-term seller pressure.
Highlights
- TRUMP closed at $5.41, trading above the MA-20 ($5.02) but below the MA-50 ($5.69) and MA-200 ($7.70), reflecting short-term bullishness amid medium- and long-term bearish pressure.
- Momentum indicators (MACD, ADX) signal strong selling on daily and weekly timeframes, while overbought readings like Stoch RSI at 100 and CCI at 141.94 reveal risk of short-term exhaustion.
- The expected 5-day price range is $5.00–$5.60 with less than 20% probability of an increase, favoring sideways or downward movement unless resistance at $5.69 is breached.
Overbought signals and weak trend momentum shape resistance outlook
The nearest dynamic support appears at the Ichimoku Kijun level ($5.39), while the next resistance is the MA-50 ($5.69). Momentum signals are mixed: MACD on D1 and W1 both indicate strong selling, while ADX also points to a sell condition, suggesting trend weakness despite today's gains. Overbought readings dominate (Stoch RSI at 100, CCI at 141.94, and BBP at 0.60), highlighting buyer domination on the day and a risk of short-term exhaustion. The price opened with a moderate gap up from the previous close ($5.07 to $5.26), rallied near the daily high, and is showing high intraday volatility, ending the session with ongoing pressure toward highs; the tone remains bullish but could be vulnerable to reversal if momentum fades.
Sideways movement expected as bearish risks outweigh upside
For the next 5 trading days, the expected price range is adjusted to $5.00 – $5.60 to reflect the current price and typical volatility. The probability of a price increase is very low (less than 20%), making a downward move more likely in the short term. The base scenario is sideways movement between $5.00 and $5.60. A bullish scenario would require a breakout above resistance at $5.69, while a bearish move could drive the price back down below support at the Kijun level, potentially revisiting the $5.00 area.
Last time, analysts noted that Official Trump (TRUMP) has moved above its short-term moving average, indicating a near-term bullish bias, but remains below key medium- and long-term averages, with mixed momentum signals as daily MACD and ADX point to selling pressure while intraday oscillators suggest increased buyer activity. Nearest support is at $5.39 with resistance near $5.60–$5.73, and persistent divergence among RSI, CCI, and Stoch RSI highlights elevated volatility and caution for trend-followers amid conflicting technical signals.


-
 Afghanistan
-
 Albania
-
 Algeria
-
 Angola
-
 Argentina
-
 Armenia
-
 Australia
-
 Austria
-
 Azerbaijan
-
 Bahamas
-
 Bahrain
-
 Bangladesh
-
 Belarus
-
 Belgium
-
 Bolivia
-
 Botswana
-
 Brazil
-
 Brunei
-
 Bulgaria
-
 Cambodia
-
 Cameroon
-
 Canada
-
 Chile
Chile
-
 China
China
-
 Colombia
-
 Congo
Congo
-
 Costa Rica
-
 Cote d'Ivoire
-
 Croatia
-
 Cuba
Cuba
-
 Cyprus
-
 Czechia
-
 DR Congo
-
 Denmark
-
 Dominican Republic
-
 Ecuador
-
 Egypt
Egypt
-
 El Salvador
-
 Estonia
-
 Eswatini
-
 Ethiopia
-
 Finland
-
 France
-
 Georgia
-
 Germany
-
 Ghana
Ghana
-
 Greece
-
 Haiti
Haiti
-
 Hong Kong
-
 Hungary
-
 India
India
-
 Indonesia
-
 Iran, Islamic republic
-
 Iraq
Iraq
-
 Ireland
-
 Israel
-
 Italy
Italy
-
 Jamaica
-
 Japan
Japan
-
 Jordan
-
 Kazakhstan
-
 Kenya
Kenya
-
 Korea
Korea
-
 Kuwait
-
 Kyrgyzstan
-
 Laos
Laos
-
 Latvia
-
 Lebanon
-
 Lesotho
-
 Libya
Libya
-
 Lithuania
-
 Luxembourg
-
 Madagascar
-
 Malaysia
-
 Malta
Malta
-
 Mauritius
-
 Mexico
-
 Moldova
-
 Mongolia
-
 Montenegro
-
 Morocco
-
 Mozambique
-
 Myanmar
-
 Namibia
-
 Nepal
Nepal
-
 Netherlands
-
 New Zealand
-
 Nigeria
-
 North Macedonia
-
 Norway
-
 Oman
Oman
-
 Pakistan
-
 Palestine
-
 Panama
-
 Papua New Guinea
-
 Paraguay
-
 Peru
Peru
-
 Philippines
-
 Poland
-
 Portugal
-
 Puerto Rico
-
 Qatar
Qatar
-
 Reunion
-
 Romania
-
 Rwanda
-
 Saudi Arabia
-
 Serbia
-
 Singapore
-
 Slovakia
-
 Slovenia
-
 Somalia
-
 South Africa
-
 Spain
Spain
-
 Sri Lanka
-
 Sweden
-
 Switzerland
-
 Syria
Syria
-
 Taiwan
-
 Tajikistan
-
 Tanzania
-
 Thailand
-
 Trinidad and Tobago
-
 Tunisia
-
 Turkey
-
 UAE
UAE
-
 Uganda
-
 Ukraine
-
 United Kingdom
-
United States
-
 Uruguay
-
 Uzbekistan
-
 Venezuela
-
 Vietnam
-
 Yemen
Yemen
-
 Zambia
-
 Zimbabwe
- Forex
- Crypto
