
Raydium: Overbought oscillators and positive bull power result in 7.60% daily jump

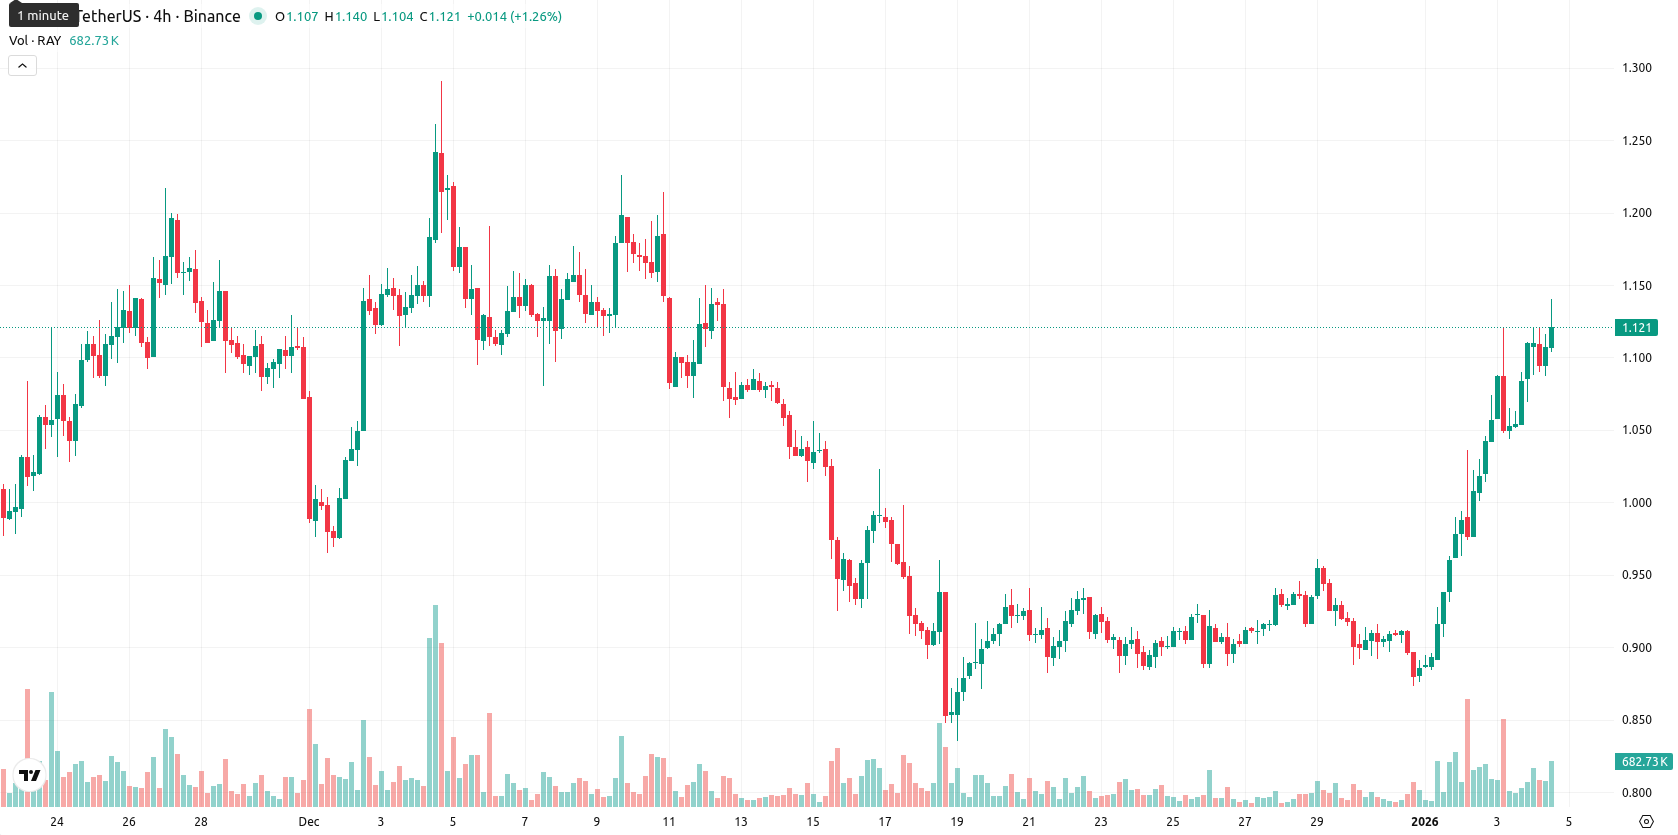
Raydium (RAY) is currently trading at $1.133, sitting above both the MA-20 ($0.9343) and MA-50 ($1.0518), but well below the MA-200 ($2.2269). This setup indicates a short- to medium-term bullish bias, while the long-term trend structure remains bearish.
Highlights
- Raydium's market capitalization stands at approximately $298.09 million, with a total supply of 554,997,846 tokens and 268,581,314 tokens circulating.
- Raydium recorded robust trading activity, as about $25.87 million worth of tokens changed hands on exchanges in the past 24 hours.
- Built on the Solana blockchain, Raydium's strong trading volumes and sizeable circulating supply reinforce its position among leading automated market maker projects.
Market cap growth as trading activity sustains robust demand
Raydium, an automated market maker built on the Solana blockchain, has achieved a market capitalization of approximately $298.09 million. The project maintains a total supply of 554,997,846 tokens and a circulating supply of 268,581,314 tokens. Trading activity remains robust, with about $25.87 million worth of Raydium changing hands on exchanges in the past day.
Mixed momentum and overbought signals as volatility spikes
The nearest dynamic support for RAY is identified at the Ichimoku Kijun level ($1.0305), with MA-50 ($1.0518) offering immediate support below. Resistance may be encountered around the $1.15 area. Momentum presents a mixed picture: the MACD issues a strong sell signal, though ADX is bullish at 28, suggesting a well-established trend. Oscillators indicate overbought conditions, as RSI hovers near 60, Stoch RSI is fully saturated at 100, and CCI is also overbought. Bull/Bear Power remains positive, reflecting intraday buyer strength, while the current rally exhibits heightened volatility. The Awesome Oscillator stands neutral, and some risk of a near-term pullback persists due to the divergence between bearish MACD and other bullish or overbought signals.
Consolidation likely as momentum indicators turn bearish or neutral
For the coming week, the short-term price outlook for RAY is a range between $1.05 and $1.19, implying a volatility band relative to current levels. With major weekly trend indicators such as RSI, ADX, MACD, and MA-50 signaling either bearish or neutral conditions, the likelihood of further upward movement is under 20%. The most probable scenario is a consolidation phase between $1.05 and $1.13 as the recent momentum subsides. A move above $1.19 could trigger more bullish sentiment, while a break below $1.05 would shift control back to sellers.
Last time, analysts noted that Raydium is exhibiting a short- to medium-term bullish trend as it trades above its MA-20 and MA-50, yet remains constrained by longer-term bearish pressure below the MA-200, with immediate support at $1.0305 and resistance in the $1.10–$1.12 zone. While RSI and short-term momentum are bullish, persistent overbought signals from CCI and Stoch RSI, alongside a bearish MACD, indicate heightened pullback risk and favor a near-term sideways or modestly bearish scenario.


Latest Raydium News


-
 Afghanistan
-
 Albania
-
 Algeria
-
 Angola
-
 Argentina
-
 Armenia
-
 Australia
-
 Austria
-
 Azerbaijan
-
 Bahamas
-
 Bahrain
-
 Bangladesh
-
 Belarus
-
 Belgium
-
 Bolivia
-
 Botswana
-
 Brazil
-
 Brunei
-
 Bulgaria
-
 Cambodia
-
 Cameroon
-
 Canada
-
 Chile
Chile
-
 China
China
-
 Colombia
-
 Congo
Congo
-
 Costa Rica
-
 Cote d'Ivoire
-
 Croatia
-
 Cuba
Cuba
-
 Cyprus
-
 Czechia
-
 DR Congo
-
 Denmark
-
 Dominican Republic
-
 Ecuador
-
 Egypt
Egypt
-
 El Salvador
-
 Estonia
-
 Eswatini
-
 Ethiopia
-
 Finland
-
 France
-
 Georgia
-
 Germany
-
 Ghana
Ghana
-
 Greece
-
 Haiti
Haiti
-
 Hong Kong
-
 Hungary
-
 India
India
-
 Indonesia
-
 Iran, Islamic republic
-
 Iraq
Iraq
-
 Ireland
-
 Israel
-
 Italy
Italy
-
 Jamaica
-
 Japan
Japan
-
 Jordan
-
 Kazakhstan
-
 Kenya
Kenya
-
 Korea
Korea
-
 Kuwait
-
 Kyrgyzstan
-
 Laos
Laos
-
 Latvia
-
 Lebanon
-
 Lesotho
-
 Libya
Libya
-
 Lithuania
-
 Luxembourg
-
 Madagascar
-
 Malaysia
-
 Malta
Malta
-
 Mauritius
-
 Mexico
-
 Moldova
-
 Mongolia
-
 Montenegro
-
 Morocco
-
 Mozambique
-
 Myanmar
-
 Namibia
-
 Nepal
Nepal
-
 Netherlands
-
 New Zealand
-
 Nigeria
-
 North Macedonia
-
 Norway
-
 Oman
Oman
-
 Pakistan
-
 Palestine
-
 Panama
-
 Papua New Guinea
-
 Paraguay
-
 Peru
Peru
-
 Philippines
-
 Poland
-
 Portugal
-
 Puerto Rico
-
 Qatar
Qatar
-
 Reunion
-
 Romania
-
 Rwanda
-
 Saudi Arabia
-
 Serbia
-
 Singapore
-
 Slovakia
-
 Slovenia
-
 Somalia
-
 South Africa
-
 Spain
Spain
-
 Sri Lanka
-
 Sweden
-
 Switzerland
-
 Syria
Syria
-
 Taiwan
-
 Tajikistan
-
 Tanzania
-
 Thailand
-
 Trinidad and Tobago
-
 Tunisia
-
 Turkey
-
 UAE
UAE
-
 Uganda
-
 Ukraine
-
 United Kingdom
-
United States
-
 Uruguay
-
 Uzbekistan
-
 Venezuela
-
 Vietnam
-
 Yemen
Yemen
-
 Zambia
-
 Zimbabwe
- Forex
- Crypto
