
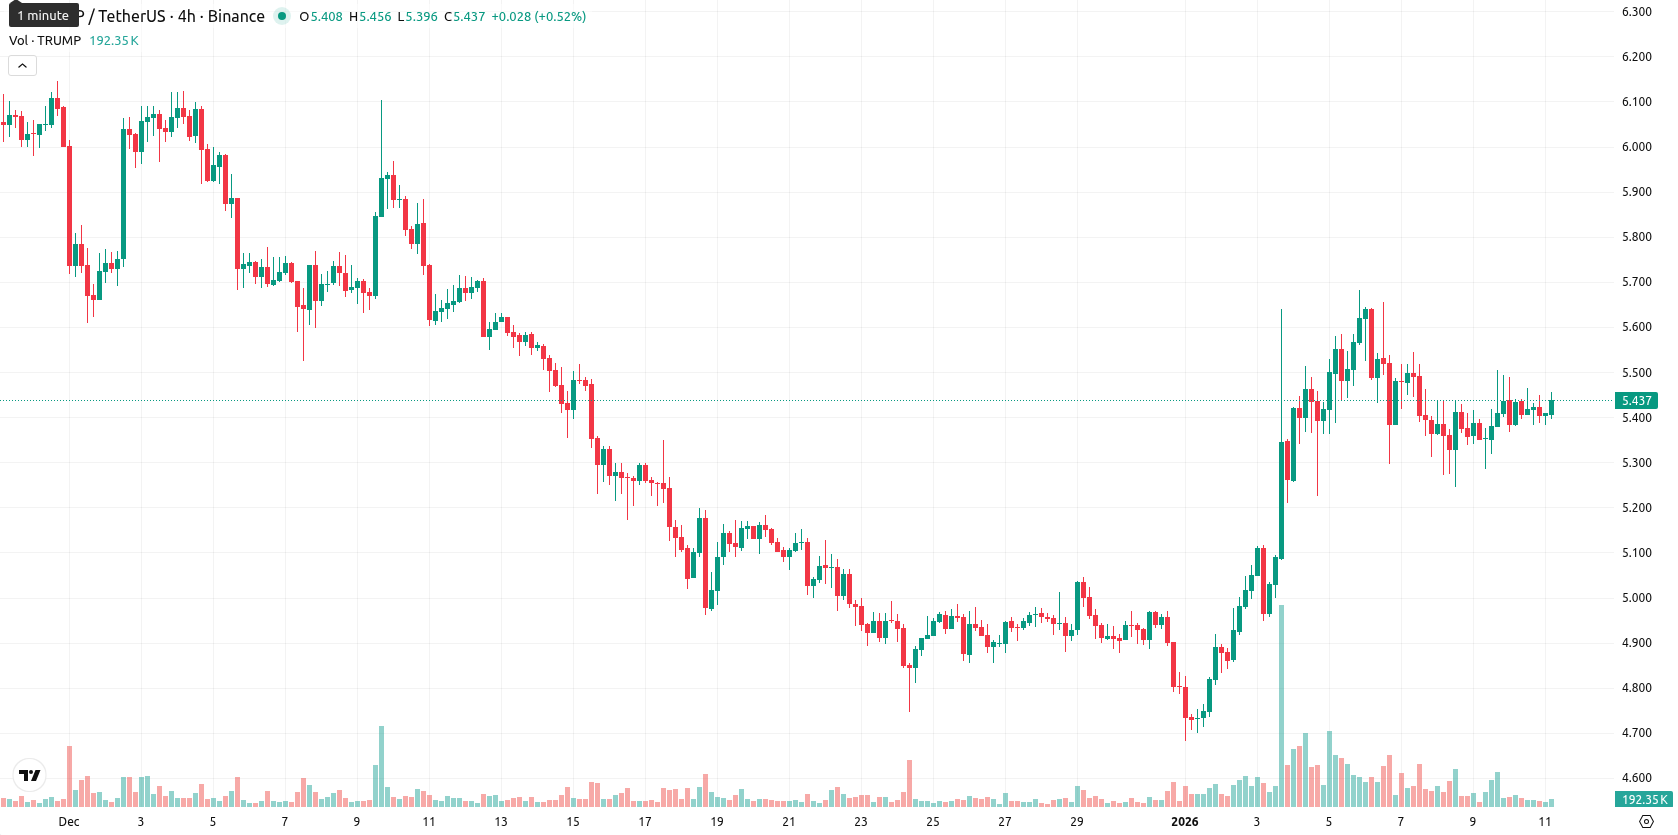
TRUMP: momentum divergence and resistance cap gains near $5.43

Official Trump (TRUMP) is currently trading at $5.43, positioned above both the MA-20 at $5.12 and just below the MA-50 at $5.49, with the long-term MA-200 much higher at $7.57. This setup points to a short-term bullish bias but some overhead resistance in the medium term, while the long-term trend remains bearish; the nearest dynamic support lies at the Ichimoku Kijun at $5.18, with immediate resistance around the MA-50 level.
Highlights
- TRUMP trades at $5.43, above the MA-20 at $5.12 and just below MA-50 at $5.49, signaling short-term bullish bias but medium-term resistance.
- Momentum indicators are mixed: RSI at 53.41 is neutral-to-bullish, but Stochastic RSI and CCI are near overbought, warning of stretched gains.
- Expected five-day price corridor is $5.26 to $5.46, with less than 20% probability of sustained upside and increased risk of renewed decline if $5.18 support breaks.
Bullish momentum wanes as oscillators warn of stretched rally
Momentum indicators are sending mixed signals. The MACD on the daily timeframe suggests a neutral stance, while the ADX indicates modest bullish momentum. RSI is in the neutral-to-bullish zone (53.41), but Stochastic RSI and CCI are close to overbought territory, cautioning that the current gains may be stretched. Bull/Bear Power shows buyers dominate the session with a positive reading, supporting minor upward bias, although the Awesome Oscillator remains neutral and does not yet confirm a trend. The daily movement was flat with virtually no gap between the previous close and today’s open. The price is currently near the upper end of today’s range, indicating low intraday volatility and a tone of quiet strength toward the highs. There is a noticeable divergence between short-term momentum and overbought oscillators, suggesting limited follow-through unless supported by stronger volume.
Sideways range likely as overbought signals meet broad downtrend
Over the next five trading days, the expected price corridor for TRUMP is $5.26 to $5.46, keeping the price near present levels. Based on the Weekly Moving Averages, RSI, ADX, and MACD, there is a very low probability (less than 20%) of a sustained price increase; a further decline is more likely. The baseline scenario is sideways consolidation between $5.26 and $5.46. A bullish scenario unfolds if the price overcomes resistance at $5.49, but persistent overbought signals and broader downward momentum increase risk of a bearish scenario, with potential for a dip to the lower end of the volatility band relative to current levels if $5.18 support fails.
Last time, analysts noted that Official Trump is trading just above its 20-day moving average and below the 50-day MA, with long-term indicators signaling prevailing bearish pressure and key support seen at the Ichimoku Kijun level and resistance capped by the MA-50. Momentum remains mixed as oscillators reflect emerging buying interest but also overbought conditions, suggesting a limited upside and a greater likelihood of short-term consolidation within a narrow range.


-
 Afghanistan
-
 Albania
-
 Algeria
-
 Angola
-
 Argentina
-
 Armenia
-
 Australia
-
 Austria
-
 Azerbaijan
-
 Bahamas
-
 Bahrain
-
 Bangladesh
-
 Belarus
-
 Belgium
-
 Bolivia
-
 Botswana
-
 Brazil
-
 Brunei
-
 Bulgaria
-
 Cambodia
-
 Cameroon
-
 Canada
-
 Chile
Chile
-
 China
China
-
 Colombia
-
 Congo
Congo
-
 Costa Rica
-
 Cote d'Ivoire
-
 Croatia
-
 Cuba
Cuba
-
 Cyprus
-
 Czechia
-
 DR Congo
-
 Denmark
-
 Dominican Republic
-
 Ecuador
-
 Egypt
Egypt
-
 El Salvador
-
 Estonia
-
 Eswatini
-
 Ethiopia
-
 Finland
-
 France
-
 Georgia
-
 Germany
-
 Ghana
Ghana
-
 Greece
-
 Haiti
Haiti
-
 Hong Kong
-
 Hungary
-
 India
India
-
 Indonesia
-
 Iran, Islamic republic
-
 Iraq
Iraq
-
 Ireland
-
 Israel
-
 Italy
Italy
-
 Jamaica
-
 Japan
Japan
-
 Jordan
-
 Kazakhstan
-
 Kenya
Kenya
-
 Korea
Korea
-
 Kuwait
-
 Kyrgyzstan
-
 Laos
Laos
-
 Latvia
-
 Lebanon
-
 Lesotho
-
 Libya
Libya
-
 Lithuania
-
 Luxembourg
-
 Madagascar
-
 Malaysia
-
 Malta
Malta
-
 Mauritius
-
 Mexico
-
 Moldova
-
 Mongolia
-
 Montenegro
-
 Morocco
-
 Mozambique
-
 Myanmar
-
 Namibia
-
 Nepal
Nepal
-
 Netherlands
-
 New Zealand
-
 Nigeria
-
 North Macedonia
-
 Norway
-
 Oman
Oman
-
 Pakistan
-
 Palestine
-
 Panama
-
 Papua New Guinea
-
 Paraguay
-
 Peru
Peru
-
 Philippines
-
 Poland
-
 Portugal
-
 Puerto Rico
-
 Qatar
Qatar
-
 Reunion
-
 Romania
-
 Rwanda
-
 Saudi Arabia
-
 Serbia
-
 Singapore
-
 Slovakia
-
 Slovenia
-
 Somalia
-
 South Africa
-
 Spain
Spain
-
 Sri Lanka
-
 Sweden
-
 Switzerland
-
 Syria
Syria
-
 Taiwan
-
 Tajikistan
-
 Tanzania
-
 Thailand
-
 Trinidad and Tobago
-
 Tunisia
-
 Turkey
-
 UAE
UAE
-
 Uganda
-
 Ukraine
-
 United Kingdom
-
United States
-
 Uruguay
-
 Uzbekistan
-
 Venezuela
-
 Vietnam
-
 Yemen
Yemen
-
 Zambia
-
 Zimbabwe
- Forex
- Crypto
