
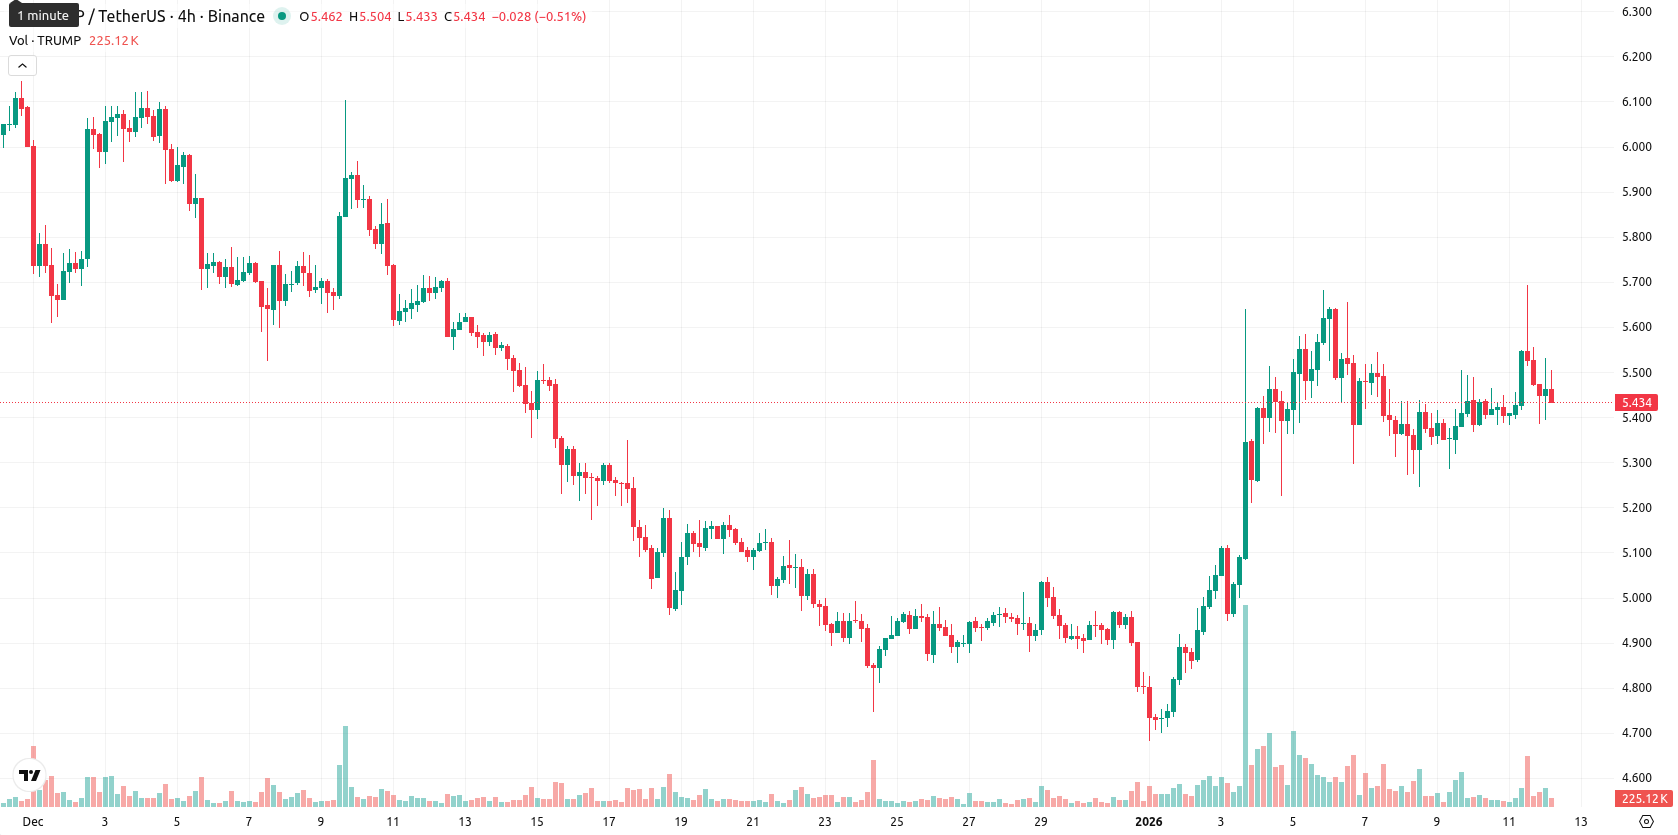
TRUMP consolidates near $5.45 as buyers show mild intraday control

Official Trump (TRUMP) is trading at $5.45, positioned above both the MA-20 ($5.14) and just under the MA-50 ($5.48), but well below the MA-200 ($7.55). This setup points to short-term bullish momentum, neutral pressure in the medium term, and a bearish long-term stance.
Highlights
- TRUMP trades at $5.45, positioned above the MA-20 ($5.14) and near the MA-50 ($5.48), signaling short-term bullish momentum but long-term bearishness remains below the MA-200 ($7.55).
- Momentum signals are mixed—MACD (D1) is neutral, ADX is 21.98 (weak trend), and Stochastic RSI suggests overbought conditions at 76.70, with buyers regaining some control per CCI (95.10).
- Expected price corridor for the next five days is $5.35–$5.55, with less than a 20% probability of a sustained price increase; a drop below $5.35 could see pullback to $5.19.
Sideways consolidation as mixed oscillators dampen trend clarity
Immediate dynamic support is found at the Ichimoku Kijun ($5.19), while the MA-50 near $5.48 serves as initial resistance. The MACD on the daily timeframe is neutral, and the ADX (21.98) signals weak but growing trend strength. The Stochastic RSI (76.70) suggests overbought conditions, while the RSI (54.14) and CCI (95.10) lean slightly toward buyers regaining control. Bull/Bear Power shows moderate buyer dominance intraday, supporting the current upward movement, whereas the Awesome Oscillator remains neutral. The current price is hovering in the middle of today's $5.39–$5.53 range, reflecting a tone of sideways consolidation with mild upward bias. Mixed momentum and oscillator readings indicate near-term indecision.
Range-bound outlook as weak momentum curbs breakout potential
For the next five sessions, the expected price band is $5.35 to $5.55, which reflects typical volatility around current levels. A sustained move and close above $5.48 would be needed for bulls to target $5.55–$5.60, while failure to hold $5.35 may trigger a pullback toward $5.19, putting sellers back in control. Overall, the baseline view is for TRUMP to hold steady within the $5.35–$5.55 range, as weak weekly momentum makes additional upside unlikely.
Previously it was reported that Official Trump is trading above its 20-day moving average but remains capped by resistance just below the 50-day MA, with long-term indicators maintaining a bearish outlook and support resting around the Ichimoku Kijun. Momentum indicators show fading bullishness as oscillators warn of overbought conditions, pointing to likely near-term consolidation in a narrow range unless stronger volume or a breakout above resistance emerges.


-
 Afghanistan
-
 Albania
-
 Algeria
-
 Angola
-
 Argentina
-
 Armenia
-
 Australia
-
 Austria
-
 Azerbaijan
-
 Bahamas
-
 Bahrain
-
 Bangladesh
-
 Belarus
-
 Belgium
-
 Bolivia
-
 Botswana
-
 Brazil
-
 Brunei
-
 Bulgaria
-
 Cambodia
-
 Cameroon
-
 Canada
-
 Chile
Chile
-
 China
China
-
 Colombia
-
 Congo
Congo
-
 Costa Rica
-
 Cote d'Ivoire
-
 Croatia
-
 Cuba
Cuba
-
 Cyprus
-
 Czechia
-
 DR Congo
-
 Denmark
-
 Dominican Republic
-
 Ecuador
-
 Egypt
Egypt
-
 El Salvador
-
 Estonia
-
 Eswatini
-
 Ethiopia
-
 Finland
-
 France
-
 Georgia
-
 Germany
-
 Ghana
Ghana
-
 Greece
-
 Haiti
Haiti
-
 Hong Kong
-
 Hungary
-
 India
India
-
 Indonesia
-
 Iran, Islamic republic
-
 Iraq
Iraq
-
 Ireland
-
 Israel
-
 Italy
Italy
-
 Jamaica
-
 Japan
Japan
-
 Jordan
-
 Kazakhstan
-
 Kenya
Kenya
-
 Korea
Korea
-
 Kuwait
-
 Kyrgyzstan
-
 Laos
Laos
-
 Latvia
-
 Lebanon
-
 Lesotho
-
 Libya
Libya
-
 Lithuania
-
 Luxembourg
-
 Madagascar
-
 Malaysia
-
 Malta
Malta
-
 Mauritius
-
 Mexico
-
 Moldova
-
 Mongolia
-
 Montenegro
-
 Morocco
-
 Mozambique
-
 Myanmar
-
 Namibia
-
 Nepal
Nepal
-
 Netherlands
-
 New Zealand
-
 Nigeria
-
 North Macedonia
-
 Norway
-
 Oman
Oman
-
 Pakistan
-
 Palestine
-
 Panama
-
 Papua New Guinea
-
 Paraguay
-
 Peru
Peru
-
 Philippines
-
 Poland
-
 Portugal
-
 Puerto Rico
-
 Qatar
Qatar
-
 Reunion
-
 Romania
-
 Rwanda
-
 Saudi Arabia
-
 Serbia
-
 Singapore
-
 Slovakia
-
 Slovenia
-
 Somalia
-
 South Africa
-
 Spain
Spain
-
 Sri Lanka
-
 Sweden
-
 Switzerland
-
 Syria
Syria
-
 Taiwan
-
 Tajikistan
-
 Tanzania
-
 Thailand
-
 Trinidad and Tobago
-
 Tunisia
-
 Turkey
-
 UAE
UAE
-
 Uganda
-
 Ukraine
-
 United Kingdom
-
United States
-
 Uruguay
-
 Uzbekistan
-
 Venezuela
-
 Vietnam
-
 Yemen
Yemen
-
 Zambia
-
 Zimbabwe
- Forex
- Crypto
