
Stellar price prediction: Can cross-border payment demand sustain XLM’s 9% rally?

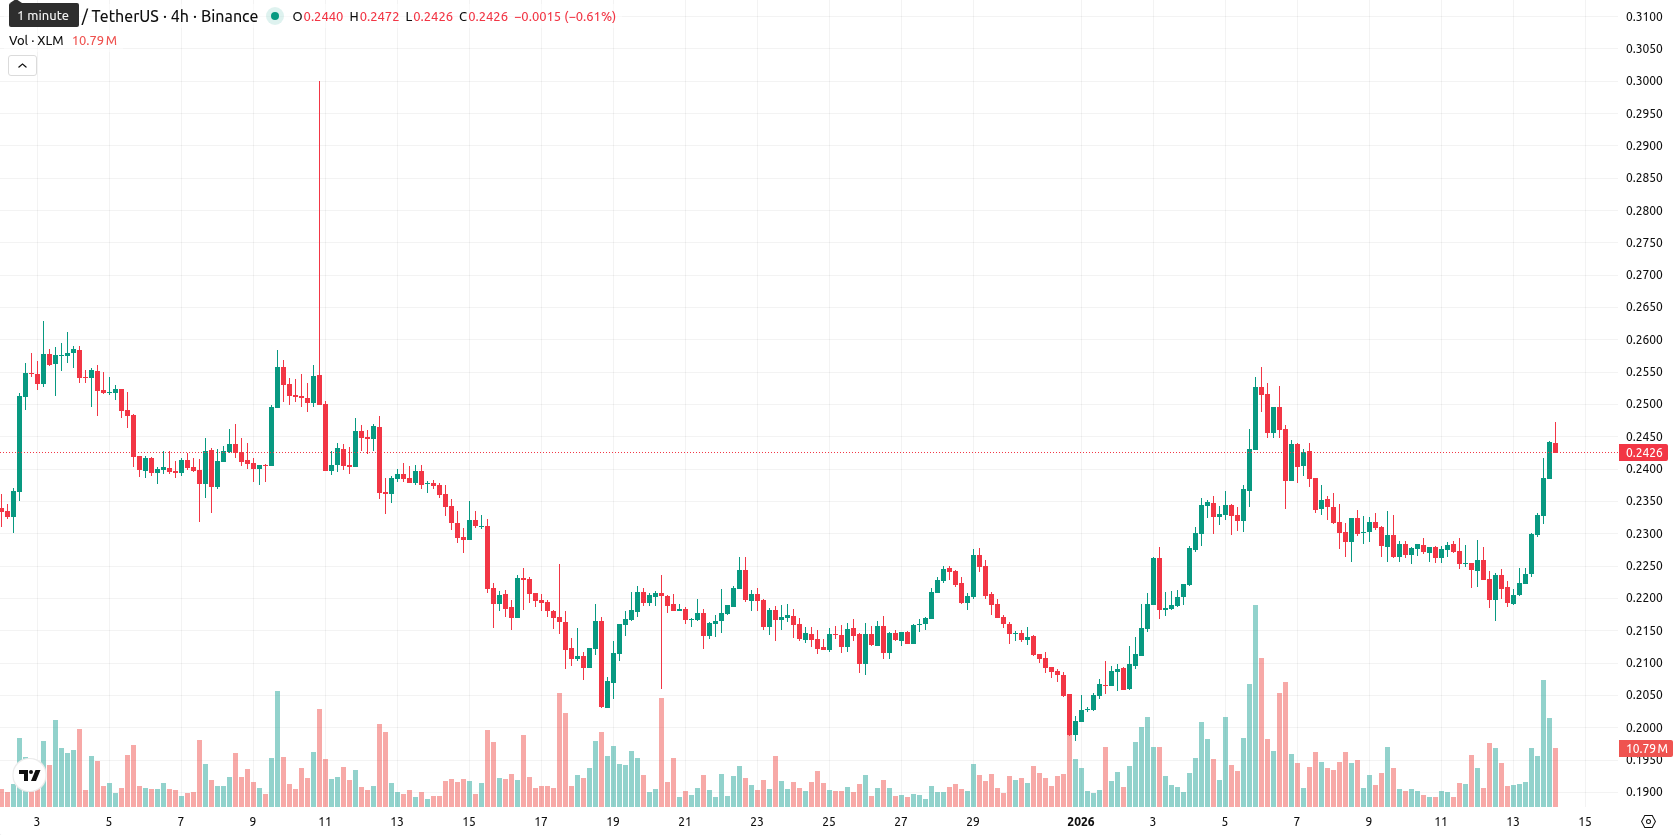
Stellar (XLM) is trading at $0.2437 after surging 9.20% intraday, moving above both the MA-20 ($0.2236) and MA-50 ($0.2313), yet remaining well below the MA-200 ($0.3248). This pattern reflects ongoing short- and medium-term momentum, countered by persistent longer-term resistance.
Highlights
- Stellar's adoption for cross-border payments and remittances accelerates through partnerships with MoneyGram, IBM, Mastercard, and WisdomTree Prime for digital fund listings.
- Institutional adoption and strategic agreements continue to drive network development and mainstream use of XLM tokens, strengthening Stellar's ecosystem.
- Ongoing regulatory developments and evolving risk factors remain closely monitored as critical influences on the network's sustainable long-term growth.
Institutional partnerships boost adoption amid regulatory uncertainty
Stellar continues to highlight its real-world applications with growing adoption for cross-border payments and remittances, supported by key partnerships with MoneyGram, IBM, Mastercard, and WisdomTree Prime for digital fund listings. Continued institutional adoption and strategic agreements drive network development and mainstream use of XLM tokens. Ongoing regulatory developments and the evolving risk landscape are closely watched as potential factors for sustainable ecosystem growth.
Mixed momentum signals as XLM tests technical resistance levels
Technical analysis shows XLM holding above the 20-day and 50-day moving averages, which provides short- and medium-term support, while the MA-200 near $0.3248 remains a significant resistance barrier. Immediate dynamic support is established by the Ichimoku Kijun at $0.2268 and MA-50 at $0.2313, with the $0.2500 level acting as the upcoming resistance. Momentum indicators are mixed: daily MACD and ADX are neutral, the RSI is at 55.77, Bull/Bear Power signals strong buy, Stochastic RSI shows a buy bias, and the CCI supports further upside; the Awesome Oscillator is neutral, reflecting no clear trend confirmation. Price behavior — a gap up at the open and trading near session highs — signals persistent buyer strength amid heightened intraday volatility.
Downside risk rises as buyers face weekly resistance
Over the next five trading days, XLM is expected to fluctuate within a price band of $0.2200–$0.2600, reflecting typical volatility compared to recent levels. The probability of further significant upside is low (below 20%), with price declines favored in the short term as sellers dominate broader weekly indicators. Sideways movement is the central outlook as bullish intraday momentum confronts resistance on longer timeframes. A sustained rally would require a decisive break above $0.2500 with strong volume, while a close below $0.2268 could usher in further retracement.
Previously it was reported that Stellar is trading above short- and medium-term moving averages, reflecting modest momentum, though it remains well below its long-term average amid sustained bearish pressure. Technical indicators are mixed, with dynamic support near $0.227, resistance at $0.245, and a low probability of a significant rally in the near term as momentum signals skew neutral to bearish.


-
 Afghanistan
-
 Albania
-
 Algeria
-
 Angola
-
 Argentina
-
 Armenia
-
 Australia
-
 Austria
-
 Azerbaijan
-
 Bahamas
-
 Bahrain
-
 Bangladesh
-
 Belarus
-
 Belgium
-
 Bolivia
-
 Botswana
-
 Brazil
-
 Brunei
-
 Bulgaria
-
 Cambodia
-
 Cameroon
-
 Canada
-
 Chile
Chile
-
 China
China
-
 Colombia
-
 Congo
Congo
-
 Costa Rica
-
 Cote d'Ivoire
-
 Croatia
-
 Cuba
Cuba
-
 Cyprus
-
 Czechia
-
 DR Congo
-
 Denmark
-
 Dominican Republic
-
 Ecuador
-
 Egypt
Egypt
-
 El Salvador
-
 Estonia
-
 Eswatini
-
 Ethiopia
-
 Finland
-
 France
-
 Georgia
-
 Germany
-
 Ghana
Ghana
-
 Greece
-
 Haiti
Haiti
-
 Hong Kong
-
 Hungary
-
 India
India
-
 Indonesia
-
 Iran, Islamic republic
-
 Iraq
Iraq
-
 Ireland
-
 Israel
-
 Italy
Italy
-
 Jamaica
-
 Japan
Japan
-
 Jordan
-
 Kazakhstan
-
 Kenya
Kenya
-
 Korea
Korea
-
 Kuwait
-
 Kyrgyzstan
-
 Laos
Laos
-
 Latvia
-
 Lebanon
-
 Lesotho
-
 Libya
Libya
-
 Lithuania
-
 Luxembourg
-
 Madagascar
-
 Malaysia
-
 Malta
Malta
-
 Mauritius
-
 Mexico
-
 Moldova
-
 Mongolia
-
 Montenegro
-
 Morocco
-
 Mozambique
-
 Myanmar
-
 Namibia
-
 Nepal
Nepal
-
 Netherlands
-
 New Zealand
-
 Nigeria
-
 North Macedonia
-
 Norway
-
 Oman
Oman
-
 Pakistan
-
 Palestine
-
 Panama
-
 Papua New Guinea
-
 Paraguay
-
 Peru
Peru
-
 Philippines
-
 Poland
-
 Portugal
-
 Puerto Rico
-
 Qatar
Qatar
-
 Reunion
-
 Romania
-
 Rwanda
-
 Saudi Arabia
-
 Serbia
-
 Singapore
-
 Slovakia
-
 Slovenia
-
 Somalia
-
 South Africa
-
 Spain
Spain
-
 Sri Lanka
-
 Sweden
-
 Switzerland
-
 Syria
Syria
-
 Taiwan
-
 Tajikistan
-
 Tanzania
-
 Thailand
-
 Trinidad and Tobago
-
 Tunisia
-
 Turkey
-
 UAE
UAE
-
 Uganda
-
 Ukraine
-
 United Kingdom
-
United States
-
 Uruguay
-
 Uzbekistan
-
 Venezuela
-
 Vietnam
-
 Yemen
Yemen
-
 Zambia
-
 Zimbabwe
- Forex
- Crypto
