
IOTA jumps 7.07% as sellers show signs of exhaustion despite technical resistance

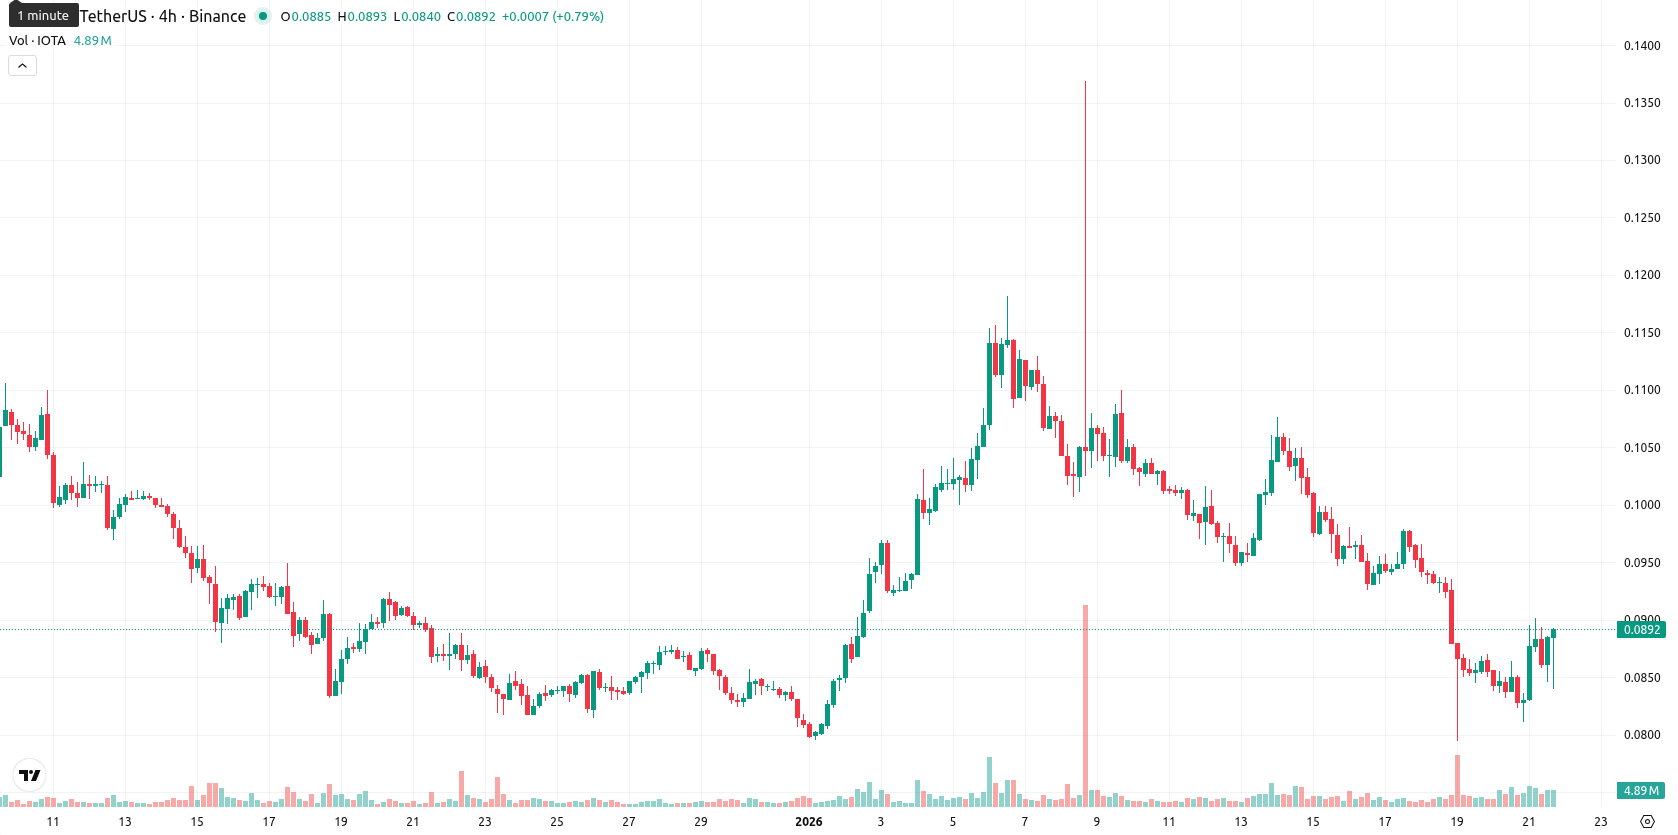
IOTA (IOTA) is trading at $0.0889, up $0.0059 or 7.07% on the day. The price remains below the MA-20 ($0.0977), MA-50 ($0.0949), and MA-200 ($0.1538), signaling persistent bearish momentum across all timeframes despite a strong intraday move toward today’s high.
Highlights
- IOTA is trading at $0.0889, staying below key moving averages (MA-20 at $0.0977, MA-50 at $0.0949, MA-200 at $0.1538), signaling bearish momentum across all timeframes.
- Despite a 7.07% daily gain ($0.0059), the MACD and RSI remain negative and oversold, highlighting weak underlying bullish strength amid volatile intraday movement.
- Price is likely to consolidate between $0.0800 and $0.0980 over the next five days, with less than a 20% chance of a near-term breakout above $0.1053.
Sustained resistance and weak momentum as sellers dominate
Technically, IOTA is suppressed beneath its main moving averages and faces dynamic resistance at the Ichimoku Kijun level ($0.1053). No golden or death cross has developed. Momentum studies point to weak underlying demand, as both MACD and ADX remain negative. Contrarily, RSI and Commodity Channel Index, along with a persistently oversold Stochastic RSI, highlight intensified seller exhaustion. Bull/Bear Power remains negative, confirming sellers’ intraday dominance.
Bearish risk prevails as range-bound trading expected
Looking ahead, IOTA is expected to trade between $0.0800 and $0.0980 in the coming five days, which reflects its typical volatility band relative to current levels. Despite today’s rally, technical readings suggest upward movement is likely to stall in this sideways channel. Seller control points to a greater probability of a renewed test of the lower end of the range. A close above $0.1053 would be required to trigger a bullish reversal, while a drop below $0.0800 would confirm a bearish extension.
Previously it was reported that IOTA is exhibiting short- and medium-term bullish momentum above its 20- and 50-day moving averages, but remains under long-term bearish pressure while support is found near the Ichimoku Kijun. Daily momentum indicators are mixed—MACD neutral, ADX bullish, but oscillators flagging overbought conditions—with a recent sharp price drop and volatility signaling an increased likelihood of near-term consolidation or downside risk between defined support and resistance levels.


Latest IOTA News


-
 Afghanistan
-
 Albania
-
 Algeria
-
 Angola
-
 Argentina
-
 Armenia
-
 Australia
-
 Austria
-
 Azerbaijan
-
 Bahamas
-
 Bahrain
-
 Bangladesh
-
 Belarus
-
 Belgium
-
 Bolivia
-
 Botswana
-
 Brazil
-
 Brunei
-
 Bulgaria
-
 Cambodia
-
 Cameroon
-
 Canada
-
 Chile
Chile
-
 China
China
-
 Colombia
-
 Congo
Congo
-
 Costa Rica
-
 Cote d'Ivoire
-
 Croatia
-
 Cuba
Cuba
-
 Cyprus
-
 Czechia
-
 DR Congo
-
 Denmark
-
 Dominican Republic
-
 Ecuador
-
 Egypt
Egypt
-
 El Salvador
-
 Estonia
-
 Eswatini
-
 Ethiopia
-
 Finland
-
 France
-
 Georgia
-
 Germany
-
 Ghana
Ghana
-
 Greece
-
 Haiti
Haiti
-
 Hong Kong
-
 Hungary
-
 India
India
-
 Indonesia
-
 Iran, Islamic republic
-
 Iraq
Iraq
-
 Ireland
-
 Israel
-
 Italy
Italy
-
 Jamaica
-
 Japan
Japan
-
 Jordan
-
 Kazakhstan
-
 Kenya
Kenya
-
 Korea
Korea
-
 Kuwait
-
 Kyrgyzstan
-
 Laos
Laos
-
 Latvia
-
 Lebanon
-
 Lesotho
-
 Libya
Libya
-
 Lithuania
-
 Luxembourg
-
 Madagascar
-
 Malaysia
-
 Malta
Malta
-
 Mauritius
-
 Mexico
-
 Moldova
-
 Mongolia
-
 Montenegro
-
 Morocco
-
 Mozambique
-
 Myanmar
-
 Namibia
-
 Nepal
Nepal
-
 Netherlands
-
 New Zealand
-
 Nigeria
-
 North Macedonia
-
 Norway
-
 Oman
Oman
-
 Pakistan
-
 Palestine
-
 Panama
-
 Papua New Guinea
-
 Paraguay
-
 Peru
Peru
-
 Philippines
-
 Poland
-
 Portugal
-
 Puerto Rico
-
 Qatar
Qatar
-
 Reunion
-
 Romania
-
 Rwanda
-
 Saudi Arabia
-
 Serbia
-
 Singapore
-
 Slovakia
-
 Slovenia
-
 Somalia
-
 South Africa
-
 Spain
Spain
-
 Sri Lanka
-
 Sweden
-
 Switzerland
-
 Syria
Syria
-
 Taiwan
-
 Tajikistan
-
 Tanzania
-
 Thailand
-
 Trinidad and Tobago
-
 Tunisia
-
 Turkey
-
 UAE
UAE
-
 Uganda
-
 Ukraine
-
 United Kingdom
-
United States
-
 Uruguay
-
 Uzbekistan
-
 Venezuela
-
 Vietnam
-
 Yemen
Yemen
-
 Zambia
-
 Zimbabwe
- Forex
- Crypto
