
Flow price prediction: More downside ahead as FLOW struggles below resistance?

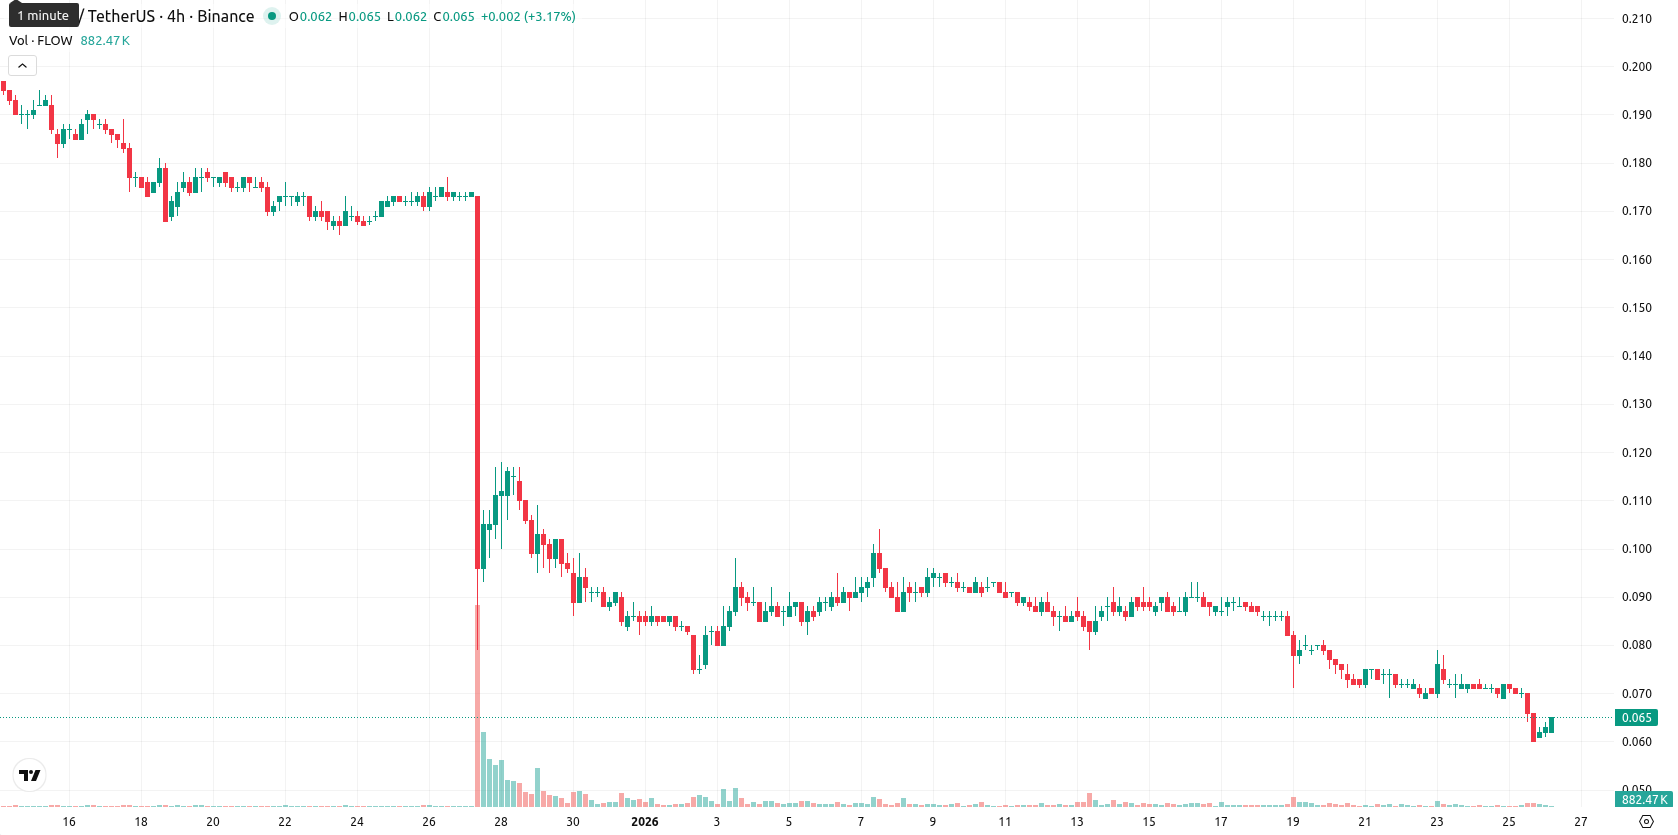
Flow (FLOW) is currently trading at $0.065 with a strong daily downward move, remaining well below its MA-20 at $0.0825, MA-50 at $0.1265, and MA-200 at $0.2861. The asset is firmly under selling pressure, and the closest dynamic resistance sits at the Ichimoku Kijun level of $0.0815.
Highlights
- FLOW trades at $0.065, below MA-20 ($0.0825), MA-50 ($0.1265), and MA-200 ($0.2861), indicating persistent multi-timeframe selling pressure.
- Momentum indicators—MACD, ADX, RSI, Stochastic RSI, and CCI—confirm strong, broad-based bearish sentiment with oversold conditions and robust downward trend.
- Expected price range for the coming week is $0.058 to $0.070, with less than 20% probability of an upward move and further downside likely if $0.058 support fails.
Bearish technical signals intensify as oversold conditions persist
Momentum indicators reflect pronounced bearish sentiment, with the MACD signaling a strong sell and a high ADX confirming the prevailing downside trend. RSI, Stochastic RSI, and CCI all indicate oversold conditions, and Bull/Bear Power is skewed towards sellers, supporting the bearish view. After a gap down at the open (previous close at $0.071, open at $0.062), FLOW is now trading at the upper end of today's volatile $0.061 – $0.065 range, with sellers maintaining control. All key indicators are aligned to the downside, with no bullish divergences.
Further downside risk dominates as weak rally odds persist
For the next week, FLOW is expected to trade in a typical volatility band between $0.058 and $0.070. The likelihood of a sustained rally is low (under 20%), with further declines favored in light of robust bearish signals across weekly and daily timeframes. Sideways action within this zone is the baseline scenario. If FLOW breaks convincingly above the Ichimoku Kijun at $0.0815, a recovery could materialize, while failure to hold $0.058 would expose the asset to deeper losses.
Previously it was reported that FLOW trades significantly below all major moving averages and faces pronounced selling pressure across multiple technical indicators, with momentum and oscillator signals such as RSI, MACD, and CCI uniformly pointing to strongly oversold and bearish conditions. The nearest resistance remains overhead at $0.0860, while a lack of substantial support and persistent negative signals indicate continued downside risk and bear dominance.


Latest FLOW News


-
 Afghanistan
-
 Albania
-
 Algeria
-
 Angola
-
 Argentina
-
 Armenia
-
 Australia
-
 Austria
-
 Azerbaijan
-
 Bahamas
-
 Bahrain
-
 Bangladesh
-
 Belarus
-
 Belgium
-
 Bolivia
-
 Botswana
-
 Brazil
-
 Brunei
-
 Bulgaria
-
 Cambodia
-
 Cameroon
-
 Canada
-
 Chile
Chile
-
 China
China
-
 Colombia
-
 Congo
Congo
-
 Costa Rica
-
 Cote d'Ivoire
-
 Croatia
-
 Cuba
Cuba
-
 Cyprus
-
 Czechia
-
 DR Congo
-
 Denmark
-
 Dominican Republic
-
 Ecuador
-
 Egypt
Egypt
-
 El Salvador
-
 Estonia
-
 Eswatini
-
 Ethiopia
-
 Finland
-
 France
-
 Georgia
-
 Germany
-
 Ghana
Ghana
-
 Greece
-
 Haiti
Haiti
-
 Hong Kong
-
 Hungary
-
 India
India
-
 Indonesia
-
 Iran, Islamic republic
-
 Iraq
Iraq
-
 Ireland
-
 Israel
-
 Italy
Italy
-
 Jamaica
-
 Japan
Japan
-
 Jordan
-
 Kazakhstan
-
 Kenya
Kenya
-
 Korea
Korea
-
 Kuwait
-
 Kyrgyzstan
-
 Laos
Laos
-
 Latvia
-
 Lebanon
-
 Lesotho
-
 Libya
Libya
-
 Lithuania
-
 Luxembourg
-
 Madagascar
-
 Malaysia
-
 Malta
Malta
-
 Mauritius
-
 Mexico
-
 Moldova
-
 Mongolia
-
 Montenegro
-
 Morocco
-
 Mozambique
-
 Myanmar
-
 Namibia
-
 Nepal
Nepal
-
 Netherlands
-
 New Zealand
-
 Nigeria
-
 North Macedonia
-
 Norway
-
 Oman
Oman
-
 Pakistan
-
 Palestine
-
 Panama
-
 Papua New Guinea
-
 Paraguay
-
 Peru
Peru
-
 Philippines
-
 Poland
-
 Portugal
-
 Puerto Rico
-
 Qatar
Qatar
-
 Reunion
-
 Romania
-
 Rwanda
-
 Saudi Arabia
-
 Serbia
-
 Singapore
-
 Slovakia
-
 Slovenia
-
 Somalia
-
 South Africa
-
 Spain
Spain
-
 Sri Lanka
-
 Sweden
-
 Switzerland
-
 Syria
Syria
-
 Taiwan
-
 Tajikistan
-
 Tanzania
-
 Thailand
-
 Trinidad and Tobago
-
 Tunisia
-
 Turkey
-
 UAE
UAE
-
 Uganda
-
 Ukraine
-
 United Kingdom
-
United States
-
 Uruguay
-
 Uzbekistan
-
 Venezuela
-
 Vietnam
-
 Yemen
Yemen
-
 Zambia
-
 Zimbabwe
- Forex
- Crypto
