
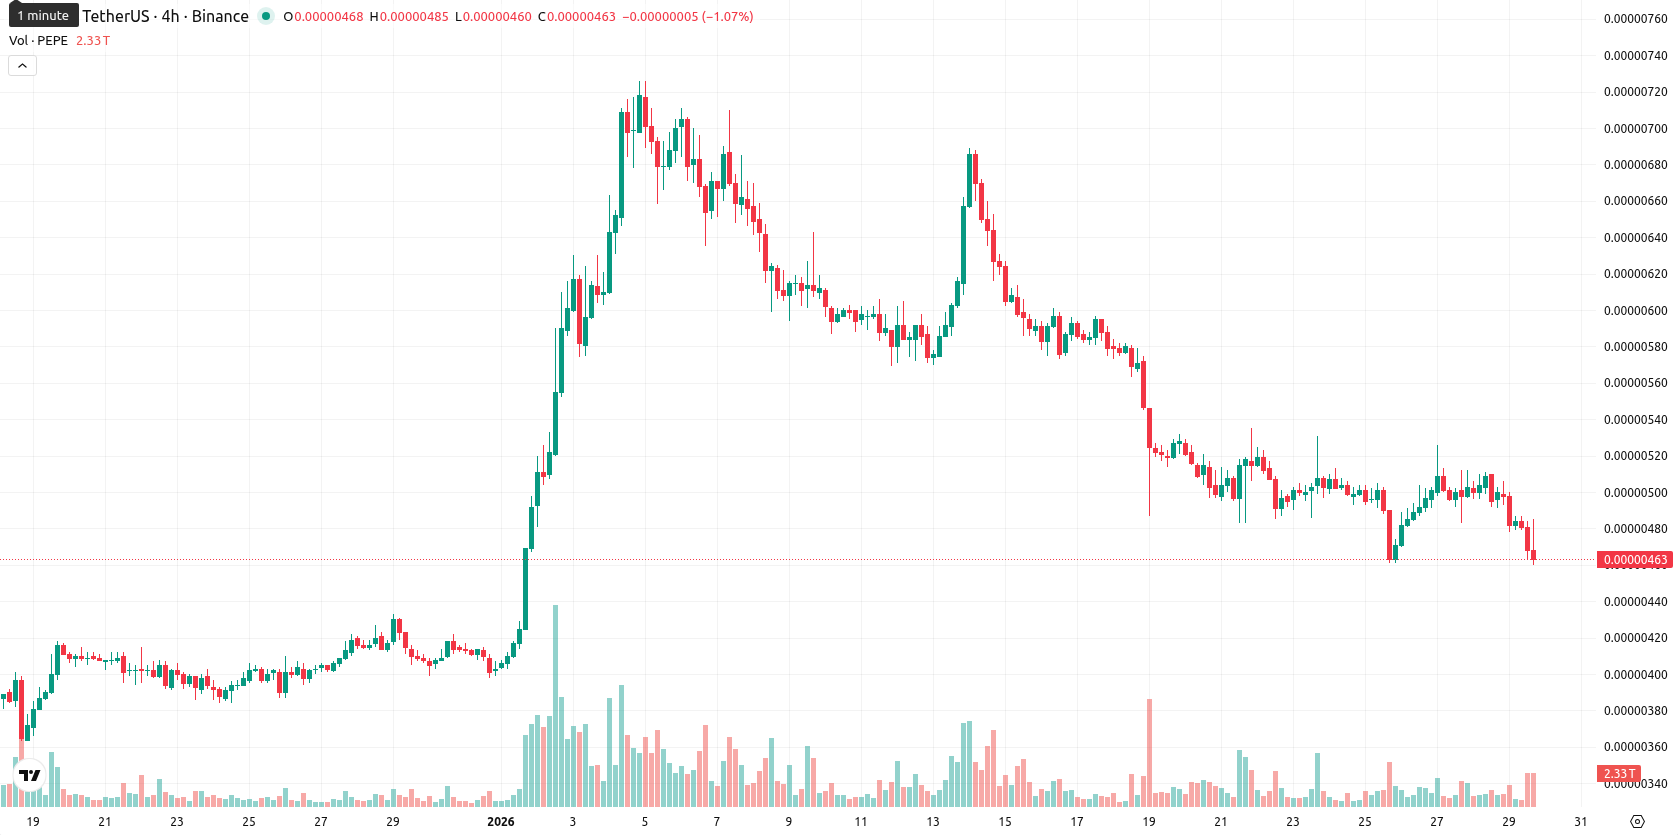
Pepe price prediction: Can tightening technical bands hold? PEPE drops 7.80%

Pepe (PEPE) is trading at $0.0000046, reflecting a daily decline of 7.80% and resting at the low of today’s range after significant volatility. The price remains under the MA-20 ($0.00000548), MA-50 ($0.00000502), and MA-200 ($0.00000786), which indicates short, medium, and long-term seller pressure.
Highlights
- PEPE is trading at $0.0000046, positioned below the MA-20 ($0.00000548), MA-50 ($0.00000502), and MA-200 ($0.00000786), signaling persistent selling pressure across timeframes.
- Momentum indicators including MACD, ADX, and the Awesome Oscillator confirm dominant bearish sentiment, with the daily price down 7.80% and closing at session lows amid high volatility.
- For the next five trading days, PEPE is likely to remain in a $0.0000042–$0.0000055 range with over 80% probability of further decline, unless resistance at $0.00000594 is overcome.
Bearish momentum prevails as sellers control key indicators
Technical indicators continue to reinforce the bearish theme for PEPE. The nearest dynamic resistance is seen at the Ichimoku Kijun level of $0.00000594, while there are no strong supports above the current price level. Momentum gauges reveal selling dominance, with the MACD and ADX signaling weak directional impetus, and the RSI (44.67), Commodity Channel Index, and Stochastic RSI suggesting mild but not extreme oversold conditions. The consistently negative Bull/Bear Power and the bearish reading from the Awesome Oscillator further confirm intraday seller control.
Downside bias persists amid tight range and weak momentum
For the next five trading days, PEPE is expected to trade within a typical volatility band between $0.0000042 and $0.0000055. Given the prevailing bearish or neutral readings across weekly RSI, ADX, MACD, and MA-50, there is over an 80% probability of continued downside pressure, with a sideways move in a narrow corridor as the baseline scenario. A bullish break would require clearing resistance at $0.00000594, while a drop below $0.0000042 would open the way for further declines.
Previously it was reported that PEPE is consolidating just at its 50-day moving average, below key short- and long-term averages, with bearish momentum and most indicators—including the RSI and oscillators—signaling sustained seller dominance. Near-term support is seen at $0.00000500 and resistance at $0.00000562, with the prevailing outlook favoring continued sideways-to-lower price action absent a breakout above immediate resistance.


Latest PEPE/USD News


-
 Afghanistan
-
 Albania
-
 Algeria
-
 Angola
-
 Argentina
-
 Armenia
-
 Australia
-
 Austria
-
 Azerbaijan
-
 Bahamas
-
 Bahrain
-
 Bangladesh
-
 Belarus
-
 Belgium
-
 Bolivia
-
 Botswana
-
 Brazil
-
 Brunei
-
 Bulgaria
-
 Cambodia
-
 Cameroon
-
 Canada
-
 Chile
Chile
-
 China
China
-
 Colombia
-
 Congo
Congo
-
 Costa Rica
-
 Cote d'Ivoire
-
 Croatia
-
 Cuba
Cuba
-
 Cyprus
-
 Czechia
-
 DR Congo
-
 Denmark
-
 Dominican Republic
-
 Ecuador
-
 Egypt
Egypt
-
 El Salvador
-
 Estonia
-
 Eswatini
-
 Ethiopia
-
 Finland
-
 France
-
 Georgia
-
 Germany
-
 Ghana
Ghana
-
 Greece
-
 Haiti
Haiti
-
 Hong Kong
-
 Hungary
-
 India
India
-
 Indonesia
-
 Iran, Islamic republic
-
 Iraq
Iraq
-
 Ireland
-
 Israel
-
 Italy
Italy
-
 Jamaica
-
 Japan
Japan
-
 Jordan
-
 Kazakhstan
-
 Kenya
Kenya
-
 Korea
Korea
-
 Kuwait
-
 Kyrgyzstan
-
 Laos
Laos
-
 Latvia
-
 Lebanon
-
 Lesotho
-
 Libya
Libya
-
 Lithuania
-
 Luxembourg
-
 Madagascar
-
 Malaysia
-
 Malta
Malta
-
 Mauritius
-
 Mexico
-
 Moldova
-
 Mongolia
-
 Montenegro
-
 Morocco
-
 Mozambique
-
 Myanmar
-
 Namibia
-
 Nepal
Nepal
-
 Netherlands
-
 New Zealand
-
 Nigeria
-
 North Macedonia
-
 Norway
-
 Oman
Oman
-
 Pakistan
-
 Palestine
-
 Panama
-
 Papua New Guinea
-
 Paraguay
-
 Peru
Peru
-
 Philippines
-
 Poland
-
 Portugal
-
 Puerto Rico
-
 Qatar
Qatar
-
 Reunion
-
 Romania
-
 Rwanda
-
 Saudi Arabia
-
 Serbia
-
 Singapore
-
 Slovakia
-
 Slovenia
-
 Somalia
-
 South Africa
-
 Spain
Spain
-
 Sri Lanka
-
 Sweden
-
 Switzerland
-
 Syria
Syria
-
 Taiwan
-
 Tajikistan
-
 Tanzania
-
 Thailand
-
 Trinidad and Tobago
-
 Tunisia
-
 Turkey
-
 UAE
UAE
-
 Uganda
-
 Ukraine
-
 United Kingdom
-
United States
-
 Uruguay
-
 Uzbekistan
-
 Venezuela
-
 Vietnam
-
 Yemen
Yemen
-
 Zambia
-
 Zimbabwe
- Forex
- Crypto
