
Technical breakdown fuels sharp drop — Nexo falls 7.06%

Nexo (NEXO) is trading at $0.764, following a daily decline of $0.058, or 7.06%. The price remains well below the MA-20 ($0.9354), MA-50 ($0.9326), and MA-200 ($1.1264), highlighting sustained selling pressure and a firm position beneath key short, medium, and long-term averages.
NEXO price prediction
Current price:
$ 0.827
0.027
3.37%
Real-time Data
21:23
Daily range
0.799
 0.845
0.845
Weekly range
0.7570
0.8270
Loading...
Highlights
- NEXO trades at $0.764, significantly below the MA-20 ($0.9354), MA-50 ($0.9326), and MA-200 ($1.1264), reflecting prolonged multi-timeframe selling pressure.
- Momentum indicators are strongly bearish with MACD, ADX, and an RSI of 28.73 in deep oversold territory, confirming persistent downside bias and dominant seller activity.
- Key support is at $0.690 and resistance at the Ichimoku Kijun ($0.9015); the baseline forecast expects further consolidation below $0.80 over the next five days.
Oversold signals intensify as intra-session volatility increases
Momentum indicators are strongly bearish across the board, with MACD and ADX signaling continued downside bias. The RSI at 28.73 and CCI at –245.68 both point to deep oversold conditions, and the Stochastic RSI sits at its minimum, emphasizing the oversold state. Bull/Bear Power (–0.0529) confirms seller dominance in intraday momentum, while the Awesome Oscillator reinforces the prevailing negative trend. Today's trading session experienced a high degree of volatility, with the price trading near the session low in a $0.694–$0.817 range, and no significant divergences among the indicators.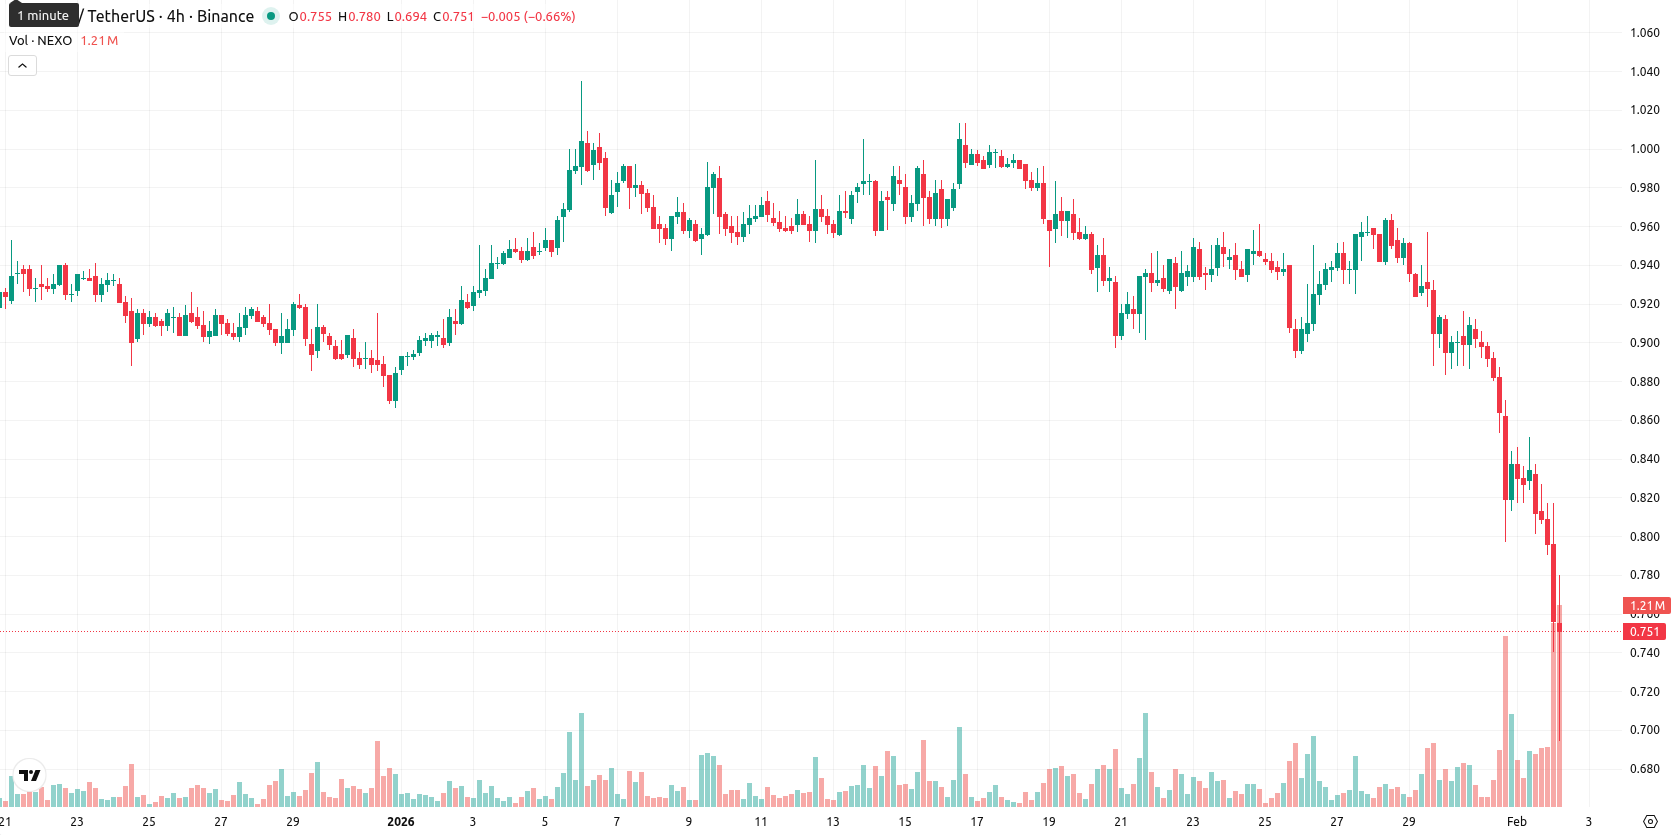
Downturn risk elevated as consolidation expected beneath resistance
Over the next five trading days, the price is expected to fluctuate between $0.690 and $0.840, forming a volatility band relative to current levels. Most indicators suggest an over 80% probability of further decline, with the likelihood of an upward move remaining very low. The base scenario projects sideways movement with consolidation below $0.80, while a bullish reversal would require a breakout above the Ichimoku Kijun at $0.9015. Conversely, a sustained drop below $0.690 could trigger accelerated downside momentum.
Anton Kharitonov, expert at Traders Union, notes that Nexo is trading below all key moving averages with momentum readings pointing firmly downward. He sees no fundamental news to change sentiment and believes that technical pressure is likely to persist. The base scenario is sideways-to-lower price action below $0.80, with clear risk if $0.690 fails. “Until Nexo reclaims $0.9015, I remain cautious and do not trust any bullish reversal attempts,” Kharitonov concludes.
Previously it was reported that Nexo (NEXO) is experiencing persistent downside pressure, trading well below all major moving averages and with a daily loss exceeding 11%, as sellers extend firm control across short-, medium-, and long-term trends. Technical indicators including MACD, ADX, and a deeply oversold RSI and Stoch RSI underscore strong bearish momentum and heightened volatility, with the asset lacking significant support and remaining vulnerable to further declines unless a decisive reversal occurs.
Source of Data:
NEXO Price Analysis by TU
The analysis is based on a proprietary model combining technical, on-chain, and expert data. Not investment advice. See
methodology
The information is based on forecasts and does not constitute investment advice or a guarantee of future results. Market conditions may change. See our Disclaimer and Editorial Integrity for details.
Subscribe to TU news
Did you like the article?


Weekly Top Bonuses

Top News


Top 5 companies for you

United States
-
 Afghanistan
-
 Albania
-
 Algeria
-
 Angola
-
 Argentina
-
 Armenia
-
 Australia
-
 Austria
-
 Azerbaijan
-
 Bahamas
-
 Bahrain
-
 Bangladesh
-
 Belarus
-
 Belgium
-
 Bolivia
-
 Botswana
-
 Brazil
-
 Brunei
-
 Bulgaria
-
 Cambodia
-
 Cameroon
-
 Canada
-
 Chile
Chile
-
 China
China
-
 Colombia
-
 Congo
Congo
-
 Costa Rica
-
 Cote d'Ivoire
-
 Croatia
-
 Cuba
Cuba
-
 Cyprus
-
 Czechia
-
 DR Congo
-
 Denmark
-
 Dominican Republic
-
 Ecuador
-
 Egypt
Egypt
-
 El Salvador
-
 Estonia
-
 Eswatini
-
 Ethiopia
-
 Finland
-
 France
-
 Georgia
-
 Germany
-
 Ghana
Ghana
-
 Greece
-
 Haiti
Haiti
-
 Hong Kong
-
 Hungary
-
 India
India
-
 Indonesia
-
 Iran, Islamic republic
-
 Iraq
Iraq
-
 Ireland
-
 Israel
-
 Italy
Italy
-
 Jamaica
-
 Japan
Japan
-
 Jordan
-
 Kazakhstan
-
 Kenya
Kenya
-
 Korea
Korea
-
 Kuwait
-
 Kyrgyzstan
-
 Laos
Laos
-
 Latvia
-
 Lebanon
-
 Lesotho
-
 Libya
Libya
-
 Lithuania
-
 Luxembourg
-
 Madagascar
-
 Malaysia
-
 Malta
Malta
-
 Mauritius
-
 Mexico
-
 Moldova
-
 Mongolia
-
 Montenegro
-
 Morocco
-
 Mozambique
-
 Myanmar
-
 Namibia
-
 Nepal
Nepal
-
 Netherlands
-
 New Zealand
-
 Nigeria
-
 North Macedonia
-
 Norway
-
 Oman
Oman
-
 Pakistan
-
 Palestine
-
 Panama
-
 Papua New Guinea
-
 Paraguay
-
 Peru
Peru
-
 Philippines
-
 Poland
-
 Portugal
-
 Puerto Rico
-
 Qatar
Qatar
-
 Reunion
-
 Romania
-
 Rwanda
-
 Saudi Arabia
-
 Serbia
-
 Singapore
-
 Slovakia
-
 Slovenia
-
 Somalia
-
 South Africa
-
 Spain
Spain
-
 Sri Lanka
-
 Sweden
-
 Switzerland
-
 Syria
Syria
-
 Taiwan
-
 Tajikistan
-
 Tanzania
-
 Thailand
-
 Trinidad and Tobago
-
 Tunisia
-
 Turkey
-
 UAE
UAE
-
 Uganda
-
 Ukraine
-
 United Kingdom
-
United States
-
 Uruguay
-
 Uzbekistan
-
 Venezuela
-
 Vietnam
-
 Yemen
Yemen
-
 Zambia
-
 Zimbabwe
- Forex
- Crypto
Live News
