
Bearish technicals confirm selling pressure — Pepe drops 7.40%

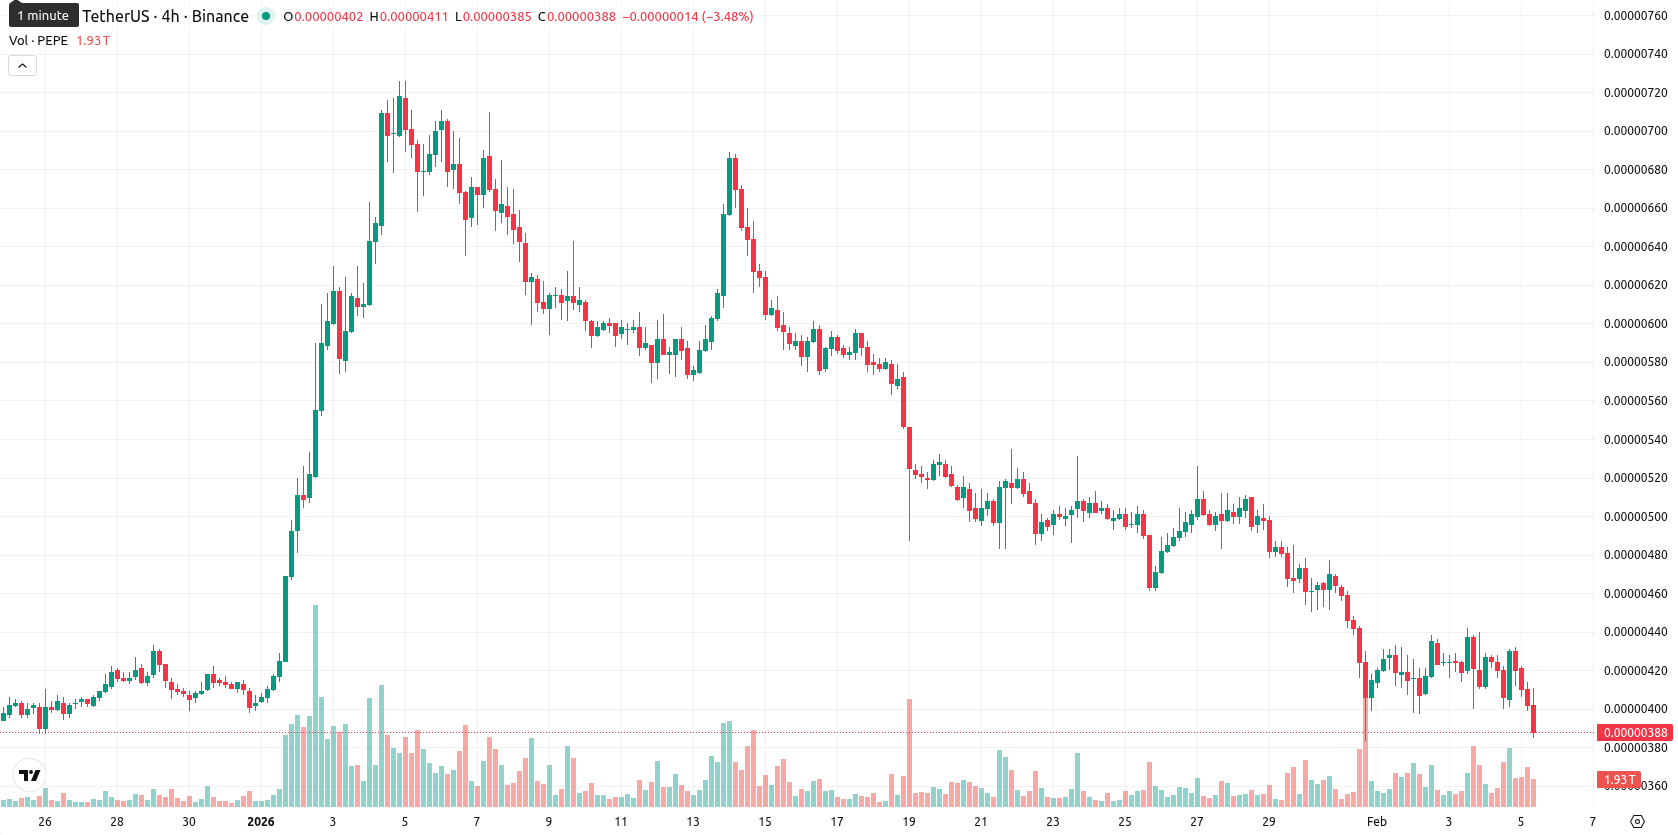
Pepe (PEPE) is trading at $0.0000039 after a 7.40% drop today, with the price sitting well below the MA-20 ($0.00000488), MA-50 ($0.00000502), and MA-200 ($0.00000756). This indicates strong selling pressure across all major trends and places the asset near the session lows in a narrow, low-volatility range.
Highlights
- PEPE is trading at $0.0000039, significantly below the MA-20 ($0.00000488), MA-50 ($0.00000502), and MA-200 ($0.00000756), reflecting persistent bearish pressure across all trend horizons.
- All major momentum indicators (MACD, ADX, Awesome Oscillator) confirm the downtrend, while Bear Power (BBP) remains negative and the probability of a near-term price increase is below 20%.
- Immediate support lies at $0.00000380, with Ichimoku Kijun resistance at $0.00000536; further declines are likely if support breaks, while closing above resistance could signal recovery.
Bearish momentum prevails despite isolated buy signals
Momentum signals for PEPE continue to skew bearish: both MACD and ADX show a lack of upward force, while RSI and CCI indicate mild oversold conditions. The Stochastic RSI provides a strong buy reading, but overall Bear Power (BBP) remains negative, confirming sellers hold control intraday. The nearest dynamic resistance is set by the Ichimoku Kijun at $0.00000536, while immediate support lies closer to the range lows. The Awesome Oscillator supports the prevailing downtrend, and there is a clear divergence between the oversold signals from Stochastic RSI and broad-based bearish momentum.
Sideways consolidation likely as breakout risks remain limited
For the next five trading days, the typical volatility range is expected between $0.00000380 and $0.00000425. The probability of a significant price increase is low — under 20% — so ongoing weakness is the base case. PEPE is likely to consolidate sideways within this band, unless a decisive move breaks above $0.00000536 to signal recovery. A slip below the $0.00000380 support could trigger further declines, as prevailing signals continue to favor sellers.
Previously it was reported that Pepe is trading below all major moving averages, with persistent bearish momentum confirmed by oversold RSI, MACD, and other momentum indicators, and resistance established near the Ichimoku Kijun level. Analysts expect the asset to consolidate sideways between established support and resistance, with limited breakout potential and sellers maintaining control in the near term.


Latest PEPE/USD News


-
 Afghanistan
-
 Albania
-
 Algeria
-
 Angola
-
 Argentina
-
 Armenia
-
 Australia
-
 Austria
-
 Azerbaijan
-
 Bahamas
-
 Bahrain
-
 Bangladesh
-
 Belarus
-
 Belgium
-
 Bolivia
-
 Botswana
-
 Brazil
-
 Brunei
-
 Bulgaria
-
 Cambodia
-
 Cameroon
-
 Canada
-
 Chile
Chile
-
 China
China
-
 Colombia
-
 Congo
Congo
-
 Costa Rica
-
 Cote d'Ivoire
-
 Croatia
-
 Cuba
Cuba
-
 Cyprus
-
 Czechia
-
 DR Congo
-
 Denmark
-
 Dominican Republic
-
 Ecuador
-
 Egypt
Egypt
-
 El Salvador
-
 Estonia
-
 Eswatini
-
 Ethiopia
-
 Finland
-
 France
-
 Georgia
-
 Germany
-
 Ghana
Ghana
-
 Greece
-
 Haiti
Haiti
-
 Hong Kong
-
 Hungary
-
 India
India
-
 Indonesia
-
 Iran, Islamic republic
-
 Iraq
Iraq
-
 Ireland
-
 Israel
-
 Italy
Italy
-
 Jamaica
-
 Japan
Japan
-
 Jordan
-
 Kazakhstan
-
 Kenya
Kenya
-
 Korea
Korea
-
 Kuwait
-
 Kyrgyzstan
-
 Laos
Laos
-
 Latvia
-
 Lebanon
-
 Lesotho
-
 Libya
Libya
-
 Lithuania
-
 Luxembourg
-
 Madagascar
-
 Malaysia
-
 Malta
Malta
-
 Mauritius
-
 Mexico
-
 Moldova
-
 Mongolia
-
 Montenegro
-
 Morocco
-
 Mozambique
-
 Myanmar
-
 Namibia
-
 Nepal
Nepal
-
 Netherlands
-
 New Zealand
-
 Nigeria
-
 North Macedonia
-
 Norway
-
 Oman
Oman
-
 Pakistan
-
 Palestine
-
 Panama
-
 Papua New Guinea
-
 Paraguay
-
 Peru
Peru
-
 Philippines
-
 Poland
-
 Portugal
-
 Puerto Rico
-
 Qatar
Qatar
-
 Reunion
-
 Romania
-
 Rwanda
-
 Saudi Arabia
-
 Serbia
-
 Singapore
-
 Slovakia
-
 Slovenia
-
 Somalia
-
 South Africa
-
 Spain
Spain
-
 Sri Lanka
-
 Sweden
-
 Switzerland
-
 Syria
Syria
-
 Taiwan
-
 Tajikistan
-
 Tanzania
-
 Thailand
-
 Trinidad and Tobago
-
 Tunisia
-
 Turkey
-
 UAE
UAE
-
 Uganda
-
 Ukraine
-
 United Kingdom
-
United States
-
 Uruguay
-
 Uzbekistan
-
 Venezuela
-
 Vietnam
-
 Yemen
Yemen
-
 Zambia
-
 Zimbabwe
- Forex
- Crypto
