
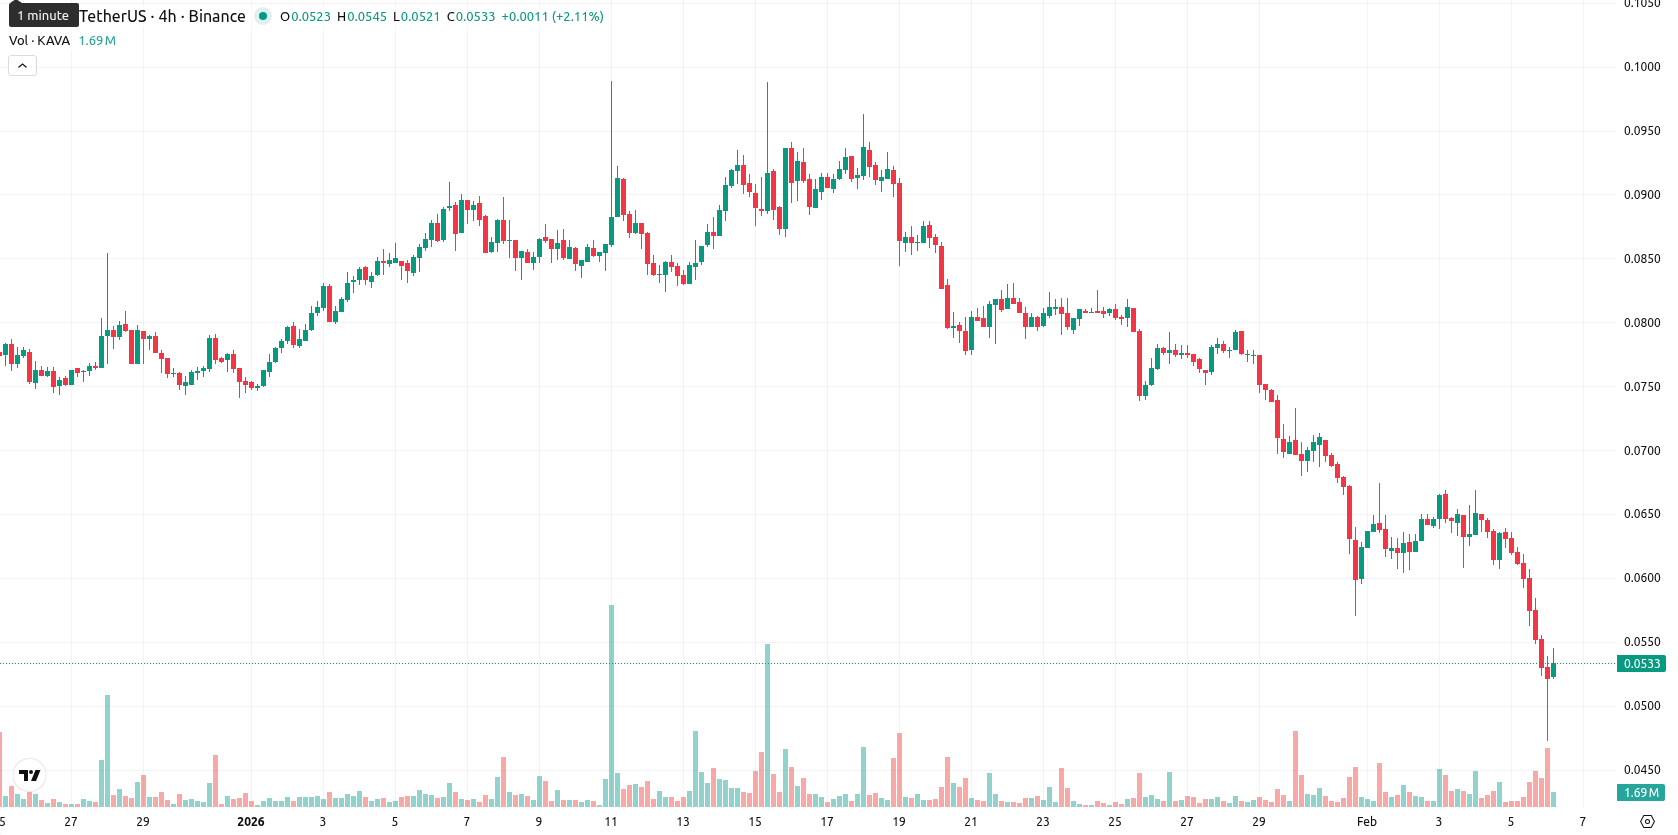
Kava price prediction: More downside ahead? KAVA sinks 12.72% to $0.0535

Kava (KAVA) is trading at $0.0535 after a sharp daily drop of 12.72%. The asset remains significantly below the MA-20 ($0.0744), MA-50 ($0.0789), and MA-200 ($0.2130), confirming strong downside pressure across all key timeframes.
Highlights
- KAVA traded sharply lower, dropping 12.72% to $0.0535, significantly below key moving averages (MA-20 $0.0744, MA-50 $0.0789, MA-200 $0.2130), confirming persistent downside pressure across all timeframes.
- Bearish momentum prevails as the MACD is firmly negative on daily and weekly charts, with ADX confirming an established weekly downtrend and all momentum oscillators (RSI, CCI, Stochastic RSI) deeply oversold.
- KAVA is projected to consolidate within a $0.049–$0.058 range over the next five days, with over 80% probability of continued weakness unless price breaks above $0.058 and challenges resistance at the Ichimoku Kijun ($0.0756).
Limited buyer support as oversold momentum and volatility persist
Momentum remains weak as the MACD is firmly negative on both daily and weekly timeframes. The ADX on the daily chart indicates low directional strength, while the weekly ADX shows a more established bearish trend. Both the RSI (D1 at 23.74, W1 at 21.07) and the Commodity Channel Index are deeply oversold, with the Stochastic RSI also confirming selling exhaustion. Bull/Bear Power and the Awesome Oscillator reinforce ongoing seller dominance, and today’s trading session was marked by decisive sell-side pressure and high volatility, with the price holding mostly near daily lows. The nearest dynamic resistance is the Ichimoku Kijun at $0.0756, while immediate support lacks a strong dynamic reference below current levels.
Sideways price risk as volatility and momentum favor further weakness
Over the short term, KAVA is likely to consolidate within a volatility band of $0.049–$0.058, with more than an 80% probability of continued weakness, as weekly trend and momentum signals point to further downside. The baseline outlook is a sideways move within this corridor. A move above $0.058 would be needed to test resistance near the Ichimoku Kijun, while a breakdown below $0.049 could lead to a deeper decline if selling intensifies.
Previously it was reported that Kava is trading well below all major moving averages, with strong bearish pressure confirmed by technical indicators such as a weak RSI, negative MACD, and fully oversold Stoch RSI, illustrating persistent seller control and limited signs of reversal. Resistance remains firm near $0.0835 with little nearby support, suggesting the continuation of the downward trend amid persistent intraday volatility.


-
 Afghanistan
-
 Albania
-
 Algeria
-
 Angola
-
 Argentina
-
 Armenia
-
 Australia
-
 Austria
-
 Azerbaijan
-
 Bahamas
-
 Bahrain
-
 Bangladesh
-
 Belarus
-
 Belgium
-
 Bolivia
-
 Botswana
-
 Brazil
-
 Brunei
-
 Bulgaria
-
 Cambodia
-
 Cameroon
-
 Canada
-
 Chile
Chile
-
 China
China
-
 Colombia
-
 Congo
Congo
-
 Costa Rica
-
 Cote d'Ivoire
-
 Croatia
-
 Cuba
Cuba
-
 Cyprus
-
 Czechia
-
 DR Congo
-
 Denmark
-
 Dominican Republic
-
 Ecuador
-
 Egypt
Egypt
-
 El Salvador
-
 Estonia
-
 Eswatini
-
 Ethiopia
-
 Finland
-
 France
-
 Georgia
-
 Germany
-
 Ghana
Ghana
-
 Greece
-
 Haiti
Haiti
-
 Hong Kong
-
 Hungary
-
 India
India
-
 Indonesia
-
 Iran, Islamic republic
-
 Iraq
Iraq
-
 Ireland
-
 Israel
-
 Italy
Italy
-
 Jamaica
-
 Japan
Japan
-
 Jordan
-
 Kazakhstan
-
 Kenya
Kenya
-
 Korea
Korea
-
 Kuwait
-
 Kyrgyzstan
-
 Laos
Laos
-
 Latvia
-
 Lebanon
-
 Lesotho
-
 Libya
Libya
-
 Lithuania
-
 Luxembourg
-
 Madagascar
-
 Malaysia
-
 Malta
Malta
-
 Mauritius
-
 Mexico
-
 Moldova
-
 Mongolia
-
 Montenegro
-
 Morocco
-
 Mozambique
-
 Myanmar
-
 Namibia
-
 Nepal
Nepal
-
 Netherlands
-
 New Zealand
-
 Nigeria
-
 North Macedonia
-
 Norway
-
 Oman
Oman
-
 Pakistan
-
 Palestine
-
 Panama
-
 Papua New Guinea
-
 Paraguay
-
 Peru
Peru
-
 Philippines
-
 Poland
-
 Portugal
-
 Puerto Rico
-
 Qatar
Qatar
-
 Reunion
-
 Romania
-
 Rwanda
-
 Saudi Arabia
-
 Serbia
-
 Singapore
-
 Slovakia
-
 Slovenia
-
 Somalia
-
 South Africa
-
 Spain
Spain
-
 Sri Lanka
-
 Sweden
-
 Switzerland
-
 Syria
Syria
-
 Taiwan
-
 Tajikistan
-
 Tanzania
-
 Thailand
-
 Trinidad and Tobago
-
 Tunisia
-
 Turkey
-
 UAE
UAE
-
 Uganda
-
 Ukraine
-
 United Kingdom
-
United States
-
 Uruguay
-
 Uzbekistan
-
 Venezuela
-
 Vietnam
-
 Yemen
Yemen
-
 Zambia
-
 Zimbabwe
- Forex
- Crypto
