
Kava price prediction: Will $0.0462 resistance spark a move as KAVA climbs 4.39%?

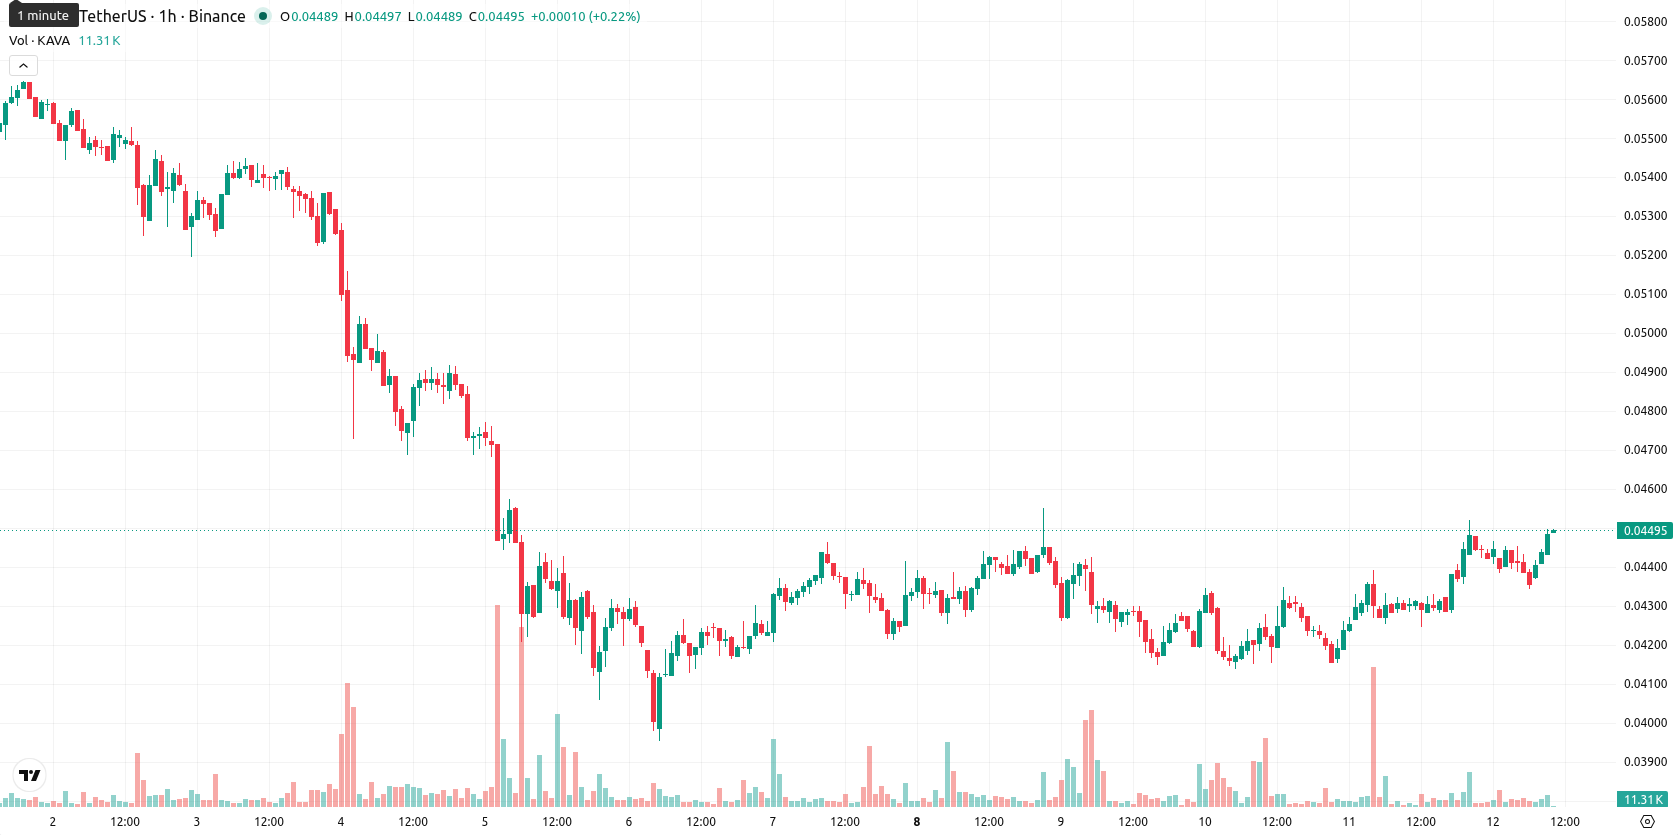
Kava (KAVA) is trading at $0.0449, up 4.39% on the day. The token is positioned above its key short- and medium-term moving averages, reflecting a strong positive move during today's high-volatility session.
Highlights
- KAVA/USD displays persistent short- and medium-term bullish momentum, supported by trading above key short-term moving averages.
- Despite positive intraday momentum and continued buyer interest, oscillators signal overbought conditions and long-term trend remains bearish.
- Projected 1-2 day price range is $0.0398 to $0.0462, with high probability of an upside move unless support breaks.
Momentum divergence emerges as short-term gains outpace longer-term trend
On the technical side, KAVA/USD has broken above the MA-20 and MA-50 on the 1-hour chart, but remains below the daily MA-200, highlighting a divergence between shorter-term momentum and the longer-term trend. The Ichimoku Kijun line at $0.0438 acts as immediate support. Momentum indicators show that MACD and ADX are signaling a buy, and RSI is in bullish territory. However, caution is warranted as the CCI signals overbought conditions and Stoch RSI is neutral. Bull/Bear Power (BBP) currently points to intraday buyer dominance, while the Awesome Oscillator (AO) remains neutral and does not confirm the ongoing upward trend. Divergence between oscillators suggests mixed sentiment at these levels.
Breakout risk rises as buyers eye key resistance level
Over the next 1–2 days, KAVA/USD is expected to trade within a volatility band of $0.0398 to $0.0462. The probability of an upside breakout is high, with buyers likely to retain control if resistance at $0.0462 is breached, which could fuel further gains. On the downside, a move below $0.0398 would increase the risk of deeper losses, but baseline expectations call for a period of consolidation within the current range.
Earlier, analysts noted that Kava was showing signs of renewed bullish momentum amid elevated volatility, with a bias toward eventual upward continuation. The latest technical signals reinforce this outlook, as persistent buyer strength suggests that a clear move above resistance could catalyze a more decisive breakout in the sessions ahead.


Latest Kava News


-
 Afghanistan
-
 Albania
-
 Algeria
-
 Angola
-
 Argentina
-
 Armenia
-
 Australia
-
 Austria
-
 Azerbaijan
-
 Bahamas
-
 Bahrain
-
 Bangladesh
-
 Belarus
-
 Belgium
-
 Bolivia
-
 Botswana
-
 Brazil
-
 Brunei
-
 Bulgaria
-
 Cambodia
-
 Cameroon
-
 Canada
-
 Chile
Chile
-
 China
China
-
 Colombia
-
 Congo
Congo
-
 Costa Rica
-
 Cote d'Ivoire
-
 Croatia
-
 Cuba
Cuba
-
 Cyprus
-
 Czechia
-
 DR Congo
-
 Denmark
-
 Dominican Republic
-
 Ecuador
-
 Egypt
Egypt
-
 El Salvador
-
 Estonia
-
 Eswatini
-
 Ethiopia
-
 Finland
-
 France
-
 Georgia
-
 Germany
-
 Ghana
Ghana
-
 Greece
-
 Haiti
Haiti
-
 Hong Kong
-
 Hungary
-
 India
India
-
 Indonesia
-
 Iran, Islamic republic
-
 Iraq
Iraq
-
 Ireland
-
 Israel
-
 Italy
Italy
-
 Jamaica
-
 Japan
Japan
-
 Jordan
-
 Kazakhstan
-
 Kenya
Kenya
-
 Korea
Korea
-
 Kuwait
-
 Kyrgyzstan
-
 Laos
Laos
-
 Latvia
-
 Lebanon
-
 Lesotho
-
 Libya
Libya
-
 Lithuania
-
 Luxembourg
-
 Madagascar
-
 Malaysia
-
 Malta
Malta
-
 Mauritius
-
 Mexico
-
 Moldova
-
 Mongolia
-
 Montenegro
-
 Morocco
-
 Mozambique
-
 Myanmar
-
 Namibia
-
 Nepal
Nepal
-
 Netherlands
-
 New Zealand
-
 Nigeria
-
 North Macedonia
-
 Norway
-
 Oman
Oman
-
 Pakistan
-
 Palestine
-
 Panama
-
 Papua New Guinea
-
 Paraguay
-
 Peru
Peru
-
 Philippines
-
 Poland
-
 Portugal
-
 Puerto Rico
-
 Qatar
Qatar
-
 Reunion
-
 Romania
-
 Rwanda
-
 Saudi Arabia
-
 Serbia
-
 Singapore
-
 Slovakia
-
 Slovenia
-
 Somalia
-
 South Africa
-
 Spain
Spain
-
 Sri Lanka
-
 Sweden
-
 Switzerland
-
 Syria
Syria
-
 Taiwan
-
 Tajikistan
-
 Tanzania
-
 Thailand
-
 Trinidad and Tobago
-
 Tunisia
-
 Turkey
-
 UAE
UAE
-
 Uganda
-
 Ukraine
-
 United Kingdom
-
United States
-
 Uruguay
-
 Uzbekistan
-
 Venezuela
-
 Vietnam
-
 Yemen
Yemen
-
 Zambia
-
 Zimbabwe
- Forex
- Crypto
