
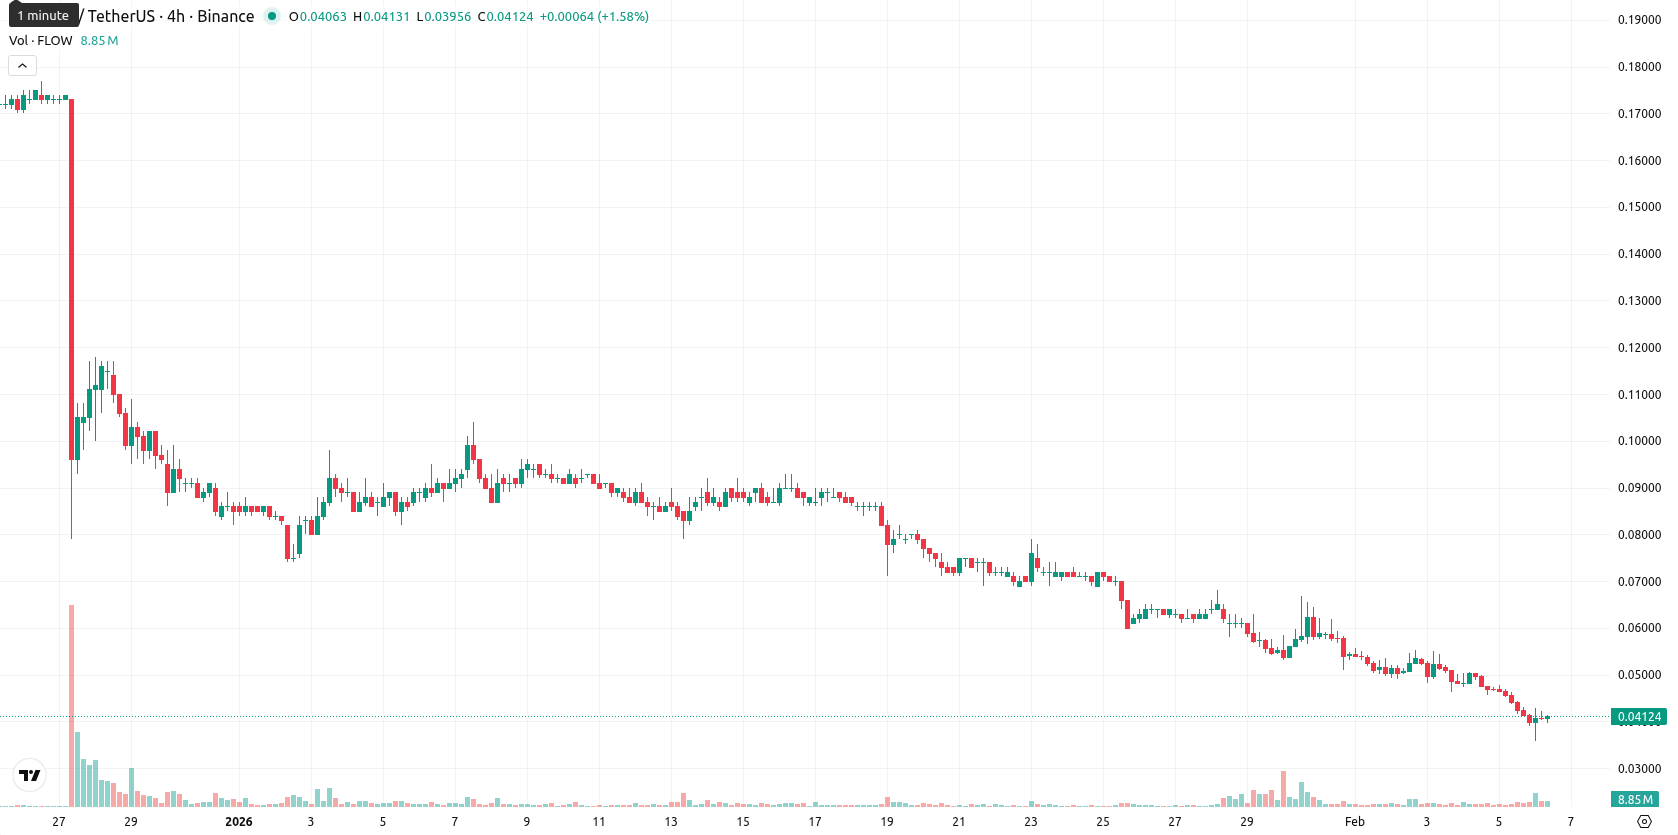
Flow slumps 7.62% as downside pressure overwhelms bullish adoption news

Flow (FLOW) is trading well below the MA-20 ($0.0631), MA-50 ($0.0942), and MA-200 ($0.2670), indicating strong downside pressure across all timeframes. The asset opened lower today, dropped 7.62%, and is currently trading near the lower end of today’s range, with high intraday volatility and clear downward pressure since the open.
Highlights
- Flow blockchain has surpassed 40 million unique user accounts and processed over 950 million transactions, underscoring robust network adoption and resilience.
- Strategic partnerships with NBA Top Shot, NFL ALL DAY, Disney, and Ticketmaster continue to reinforce Flow's position in large-scale consumer blockchain applications.
- FLOW trades well below major moving averages with strong downside pressure; expected to consolidate between $0.037 and $0.044 over the next five days amid persistent bearish technical signals.
Adoption milestones strengthen Flow's profile amid expanding partnerships
Flow has surpassed 40 million unique user accounts and processed over 950 million transactions, demonstrating strong adoption and network resilience. The platform continues to expand its ecosystem through partnerships with major consumer brands and platforms, including NBA Top Shot, NFL ALL DAY, Disney, and Ticketmaster. These milestones reinforce Flow's position as a leading blockchain for large-scale consumer applications.
Bearish momentum persists as oscillators flag oversold bounce risk
Momentum readings reflect aggressive seller control as the MACD shows a strong sell signal and the ADX confirms a persistent downtrend. Oversold conditions are signaled on the daily chart by the RSI (17.56), Stochastic RSI (18.40), and CCI (-144.23), but Bull/Bear Power remains negative, highlighting intraday seller dominance. The Awesome Oscillator also supports the bearish trend. The nearest dynamic resistance is the Ichimoku Kijun at $0.0661, while no immediate support from these indicators lies below the current price. Most momentum and oscillator signals align with the sharp downswing, though persistent oversold readings suggest a risk of a technical bounce.
Consolidation likely as downside outlook dominates short-term scenario
For the next five trading days, FLOW is expected to consolidate within a typical volatility band ranging from $0.037 to $0.044 (±8% from current levels). The probability of a sustained upside remains very low, with further declines more likely given the absence of bullish signals from weekly and daily indicators. The baseline scenario sees FLOW consolidating within this tight range. A bullish scenario would require a clear break above the Ichimoku Kijun at $0.0661, while a further drop below $0.037 would reinforce the prevailing downtrend.
Previously it was reported that Flow (FLOW) continues to demonstrate broad-based weakness, trading firmly below all key moving averages and facing sustained selling pressure across timeframes, with the Ichimoku Kijun acting as immediate resistance. Momentum and volatility indicators—including RSI, MACD, ADX, and oscillators—confirm entrenched bearishness and oversold conditions, signaling that sellers maintain firm control with no signs of reversal.


-
 Afghanistan
-
 Albania
-
 Algeria
-
 Angola
-
 Argentina
-
 Armenia
-
 Australia
-
 Austria
-
 Azerbaijan
-
 Bahamas
-
 Bahrain
-
 Bangladesh
-
 Belarus
-
 Belgium
-
 Bolivia
-
 Botswana
-
 Brazil
-
 Brunei
-
 Bulgaria
-
 Cambodia
-
 Cameroon
-
 Canada
-
 Chile
Chile
-
 China
China
-
 Colombia
-
 Congo
Congo
-
 Costa Rica
-
 Cote d'Ivoire
-
 Croatia
-
 Cuba
Cuba
-
 Cyprus
-
 Czechia
-
 DR Congo
-
 Denmark
-
 Dominican Republic
-
 Ecuador
-
 Egypt
Egypt
-
 El Salvador
-
 Estonia
-
 Eswatini
-
 Ethiopia
-
 Finland
-
 France
-
 Georgia
-
 Germany
-
 Ghana
Ghana
-
 Greece
-
 Haiti
Haiti
-
 Hong Kong
-
 Hungary
-
 India
India
-
 Indonesia
-
 Iran, Islamic republic
-
 Iraq
Iraq
-
 Ireland
-
 Israel
-
 Italy
Italy
-
 Jamaica
-
 Japan
Japan
-
 Jordan
-
 Kazakhstan
-
 Kenya
Kenya
-
 Korea
Korea
-
 Kuwait
-
 Kyrgyzstan
-
 Laos
Laos
-
 Latvia
-
 Lebanon
-
 Lesotho
-
 Libya
Libya
-
 Lithuania
-
 Luxembourg
-
 Madagascar
-
 Malaysia
-
 Malta
Malta
-
 Mauritius
-
 Mexico
-
 Moldova
-
 Mongolia
-
 Montenegro
-
 Morocco
-
 Mozambique
-
 Myanmar
-
 Namibia
-
 Nepal
Nepal
-
 Netherlands
-
 New Zealand
-
 Nigeria
-
 North Macedonia
-
 Norway
-
 Oman
Oman
-
 Pakistan
-
 Palestine
-
 Panama
-
 Papua New Guinea
-
 Paraguay
-
 Peru
Peru
-
 Philippines
-
 Poland
-
 Portugal
-
 Puerto Rico
-
 Qatar
Qatar
-
 Reunion
-
 Romania
-
 Rwanda
-
 Saudi Arabia
-
 Serbia
-
 Singapore
-
 Slovakia
-
 Slovenia
-
 Somalia
-
 South Africa
-
 Spain
Spain
-
 Sri Lanka
-
 Sweden
-
 Switzerland
-
 Syria
Syria
-
 Taiwan
-
 Tajikistan
-
 Tanzania
-
 Thailand
-
 Trinidad and Tobago
-
 Tunisia
-
 Turkey
-
 UAE
UAE
-
 Uganda
-
 Ukraine
-
 United Kingdom
-
United States
-
 Uruguay
-
 Uzbekistan
-
 Venezuela
-
 Vietnam
-
 Yemen
Yemen
-
 Zambia
-
 Zimbabwe
- Forex
- Crypto
