
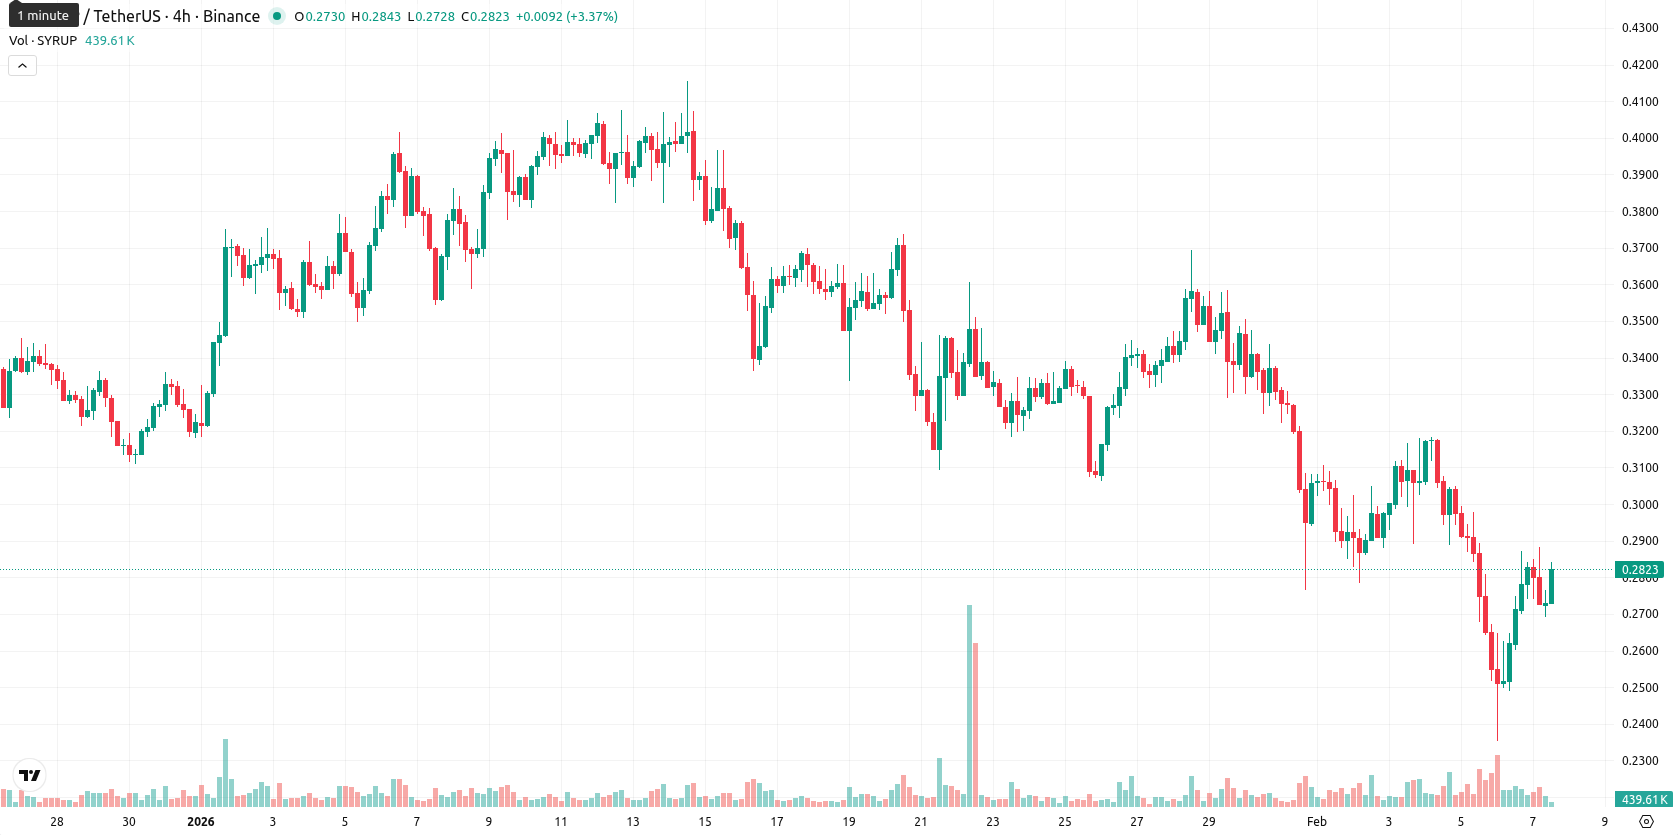
Maple: Mixed indicators and bearish momentum fuel a 7.22% daily rise

Maple (SYRUP) is trading at $0.2808 after a daily gain of 7.22%. The price remains below all key moving averages (MA-20 at $0.3210, MA-50 at $0.3428, MA-200 at $0.3871), highlighting ongoing selling pressure across short, medium, and long-term trends.
Highlights
- SYRUP trades at $0.2808, consistently below key short-, medium-, and long-term moving averages (MA-20 at $0.3210, MA-50 at $0.3428, MA-200 at $0.3871), reflecting persistent bearish pressure.
- Momentum signals are mixed, with the daily MACD showing bearish bias, ADX remaining neutral, and oscillators like RSI and CCI indicating oversold conditions, while Stochastic RSI flashes a strong buy signal.
- A range of $0.2700 to $0.3100 is forecast for the next five trading days, with baseline consolidation capped by resistance at Ichimoku Kijun ($0.3254) and downside risk dominating below $0.2700.
Weak momentum amid resistance at Ichimoku Kijun
From a technical perspective, the closest dynamic resistance is the Ichimoku Kijun at $0.3254, with no significant dynamic support visible from moving averages or Ichimoku at current levels. Momentum indicators present a mixed picture: the MACD on the daily timeframe is bearish and ADX is neutral, signaling weak trend momentum. RSI remains bearish and CCI points to oversold conditions, while the Stochastic RSI issues a strong buy signal. Both Bull/Bear Power and the Awesome Oscillator remain negative, reflecting persistent seller dominance and emphasizing the weak prevailing trend.
Limited upside as consolidation risk dominates outlook
Within the next five trading days, Maple is likely to trade within a band of $0.2700 to $0.3100, reflecting typical volatility relative to current levels. Indicator signals suggest that the probability of a sustained upward move is very low (less than 20%), with consolidation between $0.27 and $0.31 as the baseline scenario. If resistance at $0.3254 is decisively breached, a bullish breakout could occur, but a drop below $0.2700 would intensify selling and open the way to steeper losses.
Previously it was reported that Maple is exhibiting firm bearish trends across all timeframes, with the price trading significantly below its major moving averages and oversold technicals persisting amid high volatility. Momentum indicators such as MACD and ADX confirm negative sentiment, while resistance remains at the Ichimoku Kijun level and selling pressure dominates in the absence of clear support.


Latest Maple News


-
 Afghanistan
-
 Albania
-
 Algeria
-
 Angola
-
 Argentina
-
 Armenia
-
 Australia
-
 Austria
-
 Azerbaijan
-
 Bahamas
-
 Bahrain
-
 Bangladesh
-
 Belarus
-
 Belgium
-
 Bolivia
-
 Botswana
-
 Brazil
-
 Brunei
-
 Bulgaria
-
 Cambodia
-
 Cameroon
-
 Canada
-
 Chile
Chile
-
 China
China
-
 Colombia
-
 Congo
Congo
-
 Costa Rica
-
 Cote d'Ivoire
-
 Croatia
-
 Cuba
Cuba
-
 Cyprus
-
 Czechia
-
 DR Congo
-
 Denmark
-
 Dominican Republic
-
 Ecuador
-
 Egypt
Egypt
-
 El Salvador
-
 Estonia
-
 Eswatini
-
 Ethiopia
-
 Finland
-
 France
-
 Georgia
-
 Germany
-
 Ghana
Ghana
-
 Greece
-
 Haiti
Haiti
-
 Hong Kong
-
 Hungary
-
 India
India
-
 Indonesia
-
 Iran, Islamic republic
-
 Iraq
Iraq
-
 Ireland
-
 Israel
-
 Italy
Italy
-
 Jamaica
-
 Japan
Japan
-
 Jordan
-
 Kazakhstan
-
 Kenya
Kenya
-
 Korea
Korea
-
 Kuwait
-
 Kyrgyzstan
-
 Laos
Laos
-
 Latvia
-
 Lebanon
-
 Lesotho
-
 Libya
Libya
-
 Lithuania
-
 Luxembourg
-
 Madagascar
-
 Malaysia
-
 Malta
Malta
-
 Mauritius
-
 Mexico
-
 Moldova
-
 Mongolia
-
 Montenegro
-
 Morocco
-
 Mozambique
-
 Myanmar
-
 Namibia
-
 Nepal
Nepal
-
 Netherlands
-
 New Zealand
-
 Nigeria
-
 North Macedonia
-
 Norway
-
 Oman
Oman
-
 Pakistan
-
 Palestine
-
 Panama
-
 Papua New Guinea
-
 Paraguay
-
 Peru
Peru
-
 Philippines
-
 Poland
-
 Portugal
-
 Puerto Rico
-
 Qatar
Qatar
-
 Reunion
-
 Romania
-
 Rwanda
-
 Saudi Arabia
-
 Serbia
-
 Singapore
-
 Slovakia
-
 Slovenia
-
 Somalia
-
 South Africa
-
 Spain
Spain
-
 Sri Lanka
-
 Sweden
-
 Switzerland
-
 Syria
Syria
-
 Taiwan
-
 Tajikistan
-
 Tanzania
-
 Thailand
-
 Trinidad and Tobago
-
 Tunisia
-
 Turkey
-
 UAE
UAE
-
 Uganda
-
 Ukraine
-
 United Kingdom
-
United States
-
 Uruguay
-
 Uzbekistan
-
 Venezuela
-
 Vietnam
-
 Yemen
Yemen
-
 Zambia
-
 Zimbabwe
- Forex
- Crypto
