
Movement: Strong downside pressure and volatility lead to further losses

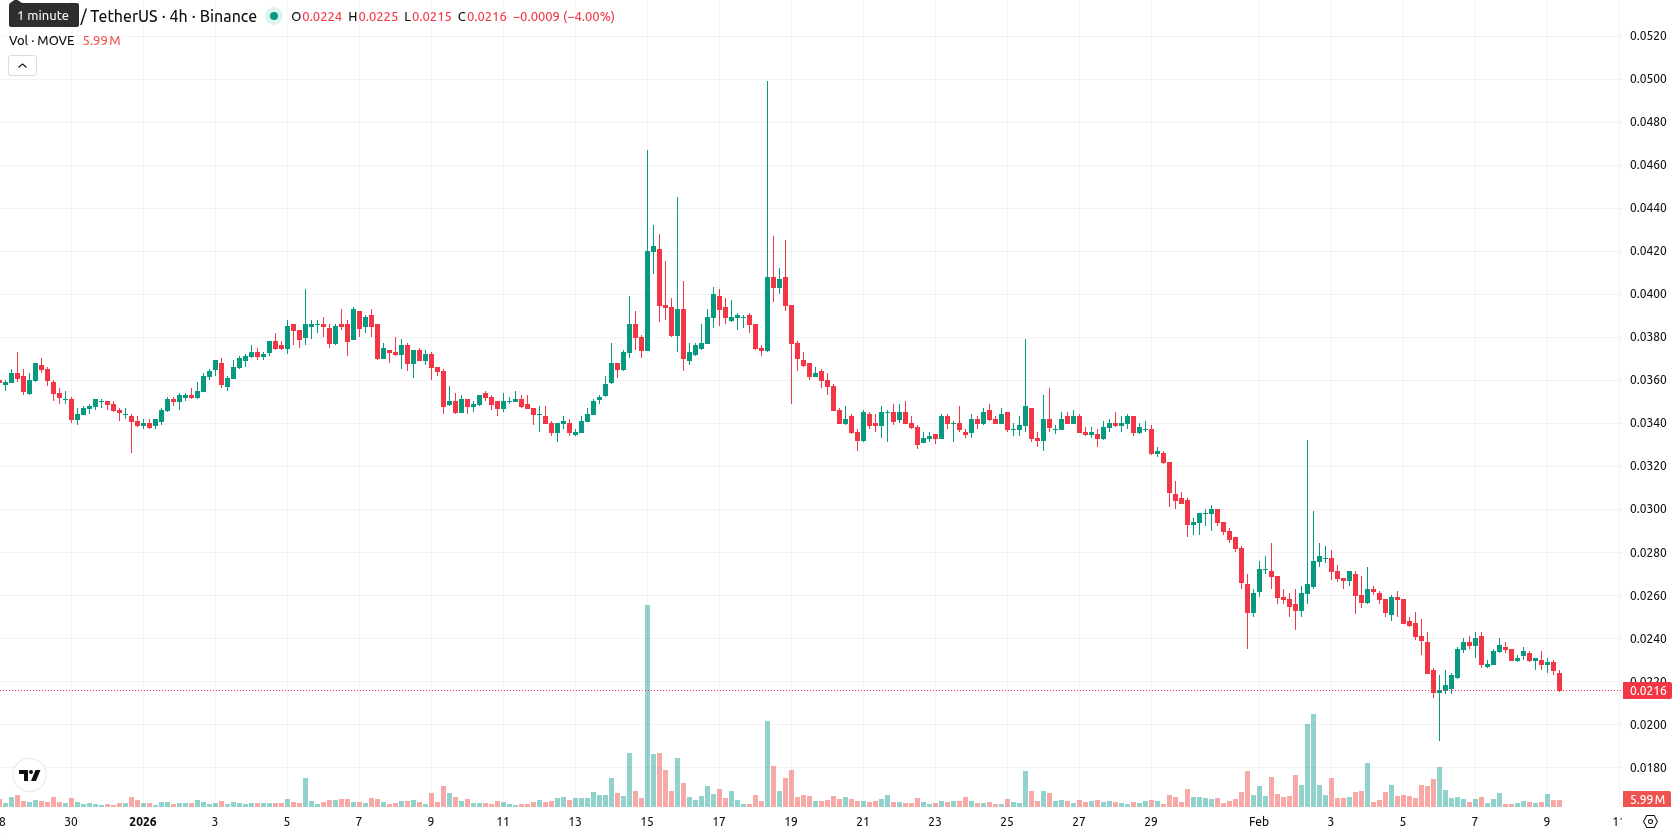
Movement (MOVE) is trading at $0.0216, well below the MA-20 ($0.0293), MA-50 ($0.0334), and MA-200 ($0.0784), confirming strong short-, medium-, and long-term downward momentum. The price has dropped 7.30% today and remains at the low end of the $0.0215 – $0.0231 range, underscoring high volatility and persistent selling since the session began.
Highlights
- MOVE trades at $0.0216, substantially below MA-20 ($0.0293), MA-50 ($0.0334), and MA-200 ($0.0784), confirming strong multi-timeframe bearish momentum.
- Momentum indicators including MACD, ADX (19.81), and oscillators signal persistent seller dominance with oversold conditions yet no bullish divergences or reversal signs.
- Immediate resistance stands at the Ichimoku Kijun ($0.0346), with critical support at $0.0211; failure to hold risks further declines, probability of additional weakness exceeds 80%.
Negative momentum prevails as resistance blocks upside recovery
MOVE faces stiff dynamic resistance on the daily chart at the Ichimoku Kijun ($0.0346), with no significant support above the current price in the short term. Downside pressure is reinforced by negative momentum: MACD signals continued weakness, ADX at 19.81 reflects a weak but steady trend, and oversold readings on the daily RSI (31.46), Stochastic RSI, and CCI suggest limited potential for rebound. Intraday Bull/Bear Power and the Awesome Oscillator confirm seller dominance. No bullish divergences have emerged, and daily momentum aligns with persistent negative intraday action.
Weakness risk remains as volatility shapes short-term trading range
Over the next five trading days, MOVE is expected to trade within a $0.0211 – $0.0260 volatility band relative to current levels, reflecting prevailing high volatility. The probability of continued weakness is over 80%, and short-term stabilization is likely to occur just above $0.0210. A sustained bounce would require a move above $0.0346, while a breakdown below $0.0211 could lead to further declines.
Previously it was reported that Movement (MOVE) remains entrenched in a short- and long-term bearish trend, trading well below its key moving averages with technical indicators such as MACD and ADX confirming seller control, while the RSI and similar oscillators signal oversold conditions. Short-term consolidation is expected within a narrow range, with resistance at $0.0250 and heightened risk of deeper declines should support at $0.0200 fail.


-
 Afghanistan
-
 Albania
-
 Algeria
-
 Angola
-
 Argentina
-
 Armenia
-
 Australia
-
 Austria
-
 Azerbaijan
-
 Bahamas
-
 Bahrain
-
 Bangladesh
-
 Belarus
-
 Belgium
-
 Bolivia
-
 Botswana
-
 Brazil
-
 Brunei
-
 Bulgaria
-
 Cambodia
-
 Cameroon
-
 Canada
-
 Chile
Chile
-
 China
China
-
 Colombia
-
 Congo
Congo
-
 Costa Rica
-
 Cote d'Ivoire
-
 Croatia
-
 Cuba
Cuba
-
 Cyprus
-
 Czechia
-
 DR Congo
-
 Denmark
-
 Dominican Republic
-
 Ecuador
-
 Egypt
Egypt
-
 El Salvador
-
 Estonia
-
 Eswatini
-
 Ethiopia
-
 Finland
-
 France
-
 Georgia
-
 Germany
-
 Ghana
Ghana
-
 Greece
-
 Haiti
Haiti
-
 Hong Kong
-
 Hungary
-
 India
India
-
 Indonesia
-
 Iran, Islamic republic
-
 Iraq
Iraq
-
 Ireland
-
 Israel
-
 Italy
Italy
-
 Jamaica
-
 Japan
Japan
-
 Jordan
-
 Kazakhstan
-
 Kenya
Kenya
-
 Korea
Korea
-
 Kuwait
-
 Kyrgyzstan
-
 Laos
Laos
-
 Latvia
-
 Lebanon
-
 Lesotho
-
 Libya
Libya
-
 Lithuania
-
 Luxembourg
-
 Madagascar
-
 Malaysia
-
 Malta
Malta
-
 Mauritius
-
 Mexico
-
 Moldova
-
 Mongolia
-
 Montenegro
-
 Morocco
-
 Mozambique
-
 Myanmar
-
 Namibia
-
 Nepal
Nepal
-
 Netherlands
-
 New Zealand
-
 Nigeria
-
 North Macedonia
-
 Norway
-
 Oman
Oman
-
 Pakistan
-
 Palestine
-
 Panama
-
 Papua New Guinea
-
 Paraguay
-
 Peru
Peru
-
 Philippines
-
 Poland
-
 Portugal
-
 Puerto Rico
-
 Qatar
Qatar
-
 Reunion
-
 Romania
-
 Rwanda
-
 Saudi Arabia
-
 Serbia
-
 Singapore
-
 Slovakia
-
 Slovenia
-
 Somalia
-
 South Africa
-
 Spain
Spain
-
 Sri Lanka
-
 Sweden
-
 Switzerland
-
 Syria
Syria
-
 Taiwan
-
 Tajikistan
-
 Tanzania
-
 Thailand
-
 Trinidad and Tobago
-
 Tunisia
-
 Turkey
-
 UAE
UAE
-
 Uganda
-
 Ukraine
-
 United Kingdom
-
United States
-
 Uruguay
-
 Uzbekistan
-
 Venezuela
-
 Vietnam
-
 Yemen
Yemen
-
 Zambia
-
 Zimbabwe
- Forex
- Crypto
