
-7.07% for Plasma — sellers extend control amid lack of support

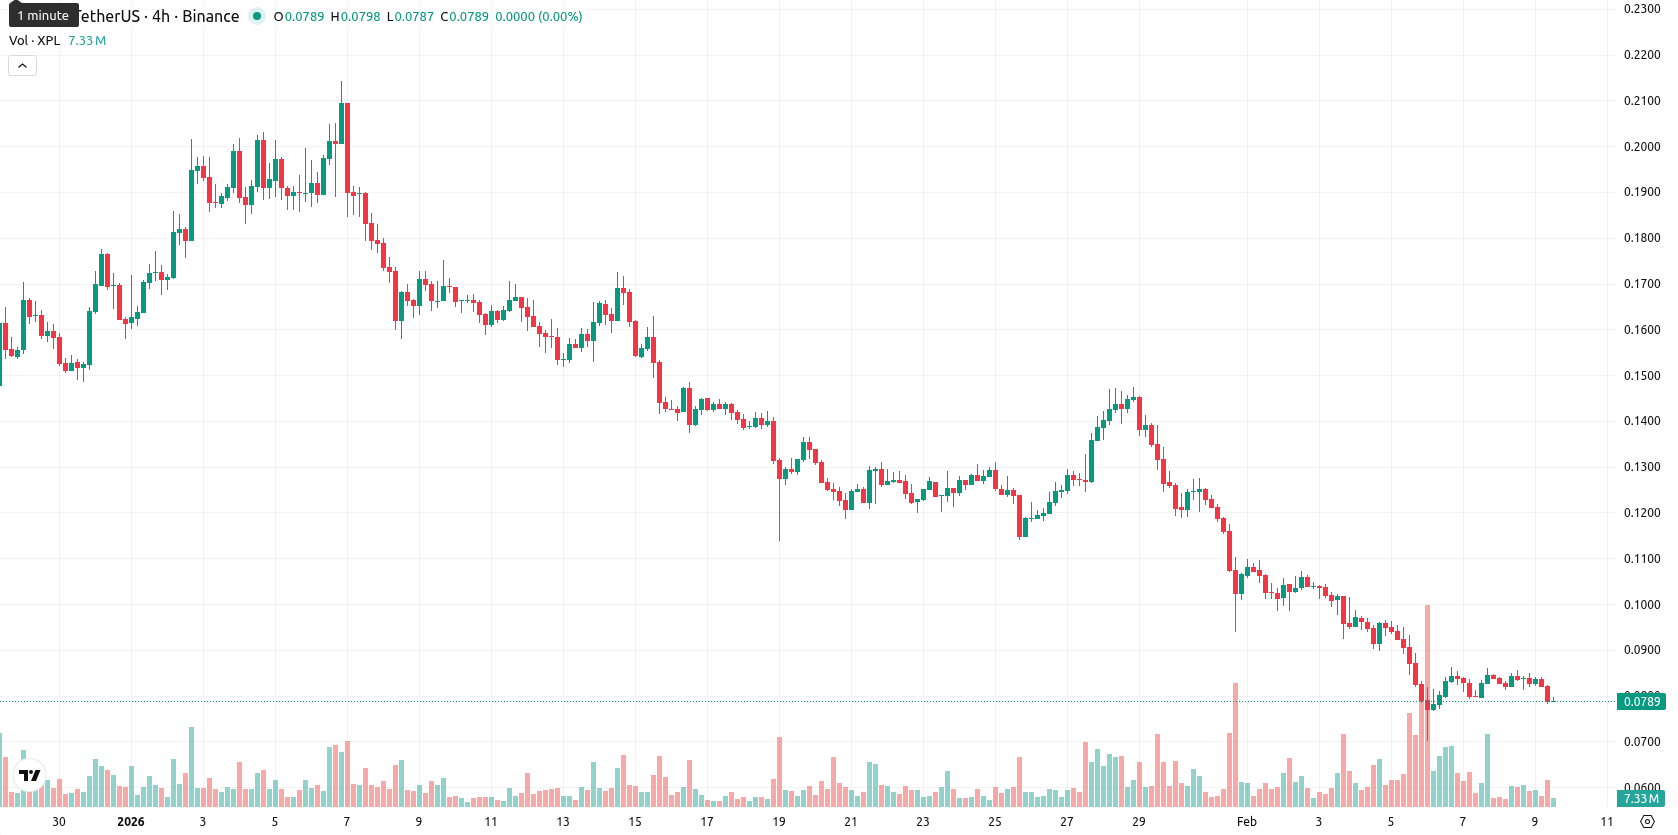
Plasma (XPL) is trading at $0.0789, which sits well below both its MA-20 ($0.1116) and MA-50 ($0.1397), highlighting sustained short- and medium-term selling pressure.
Highlights
- Plasma (XPL) trades at $0.0789, significantly below its MA-20 ($0.1116) and MA-50 ($0.1397), reflecting persistent short- and medium-term selling pressure.
- Daily momentum remains strongly bearish, with the MACD indicating a persistent downtrend and a 7.07% intraday decline confirming seller dominance.
- Near-term price range is projected at $0.0710–$0.0870, with over 80% probability of further downside unless resistance at $0.1213 is breached.
Bearish momentum persists as oversold signals intensify
The nearest dynamic resistance is identified around the Ichimoku Kijun at $0.1213, while there is no valid longer-term support as MA-200 is unavailable. Daily momentum remains firmly bearish: the MACD signals a persistent downtrend, reinforced by a strong selling reading from ADX. Multiple oscillators, including RSI (31), Stochastic RSI (oversold), and CCI (oversold at -112), all point to pronounced oversold conditions, while the Bull/Bear Power indicates sellers continue to dominate intraday action.
Downside risk heightened as price stays within volatility band
For the next five trading days, the expected price range is adjusted to $0.0710 – $0.0870, describing the volatility band relative to current levels. There is a very high probability (more than 80%) of further downside, with a price recovery seen as less likely. The baseline scenario sees XPL stabilizing within this corridor. A bullish scenario would require breaking above resistance around $0.1213, while a bearish outcome involves a move below $0.0710, leading to further weakness. All main technical signals, both daily and weekly, currently point toward downside risk dominating the short-term outlook.
Last time, analysts noted that Plasma (XPL) is trading well below key moving averages, with persistent bearish momentum confirmed by negative MACD, ADX, and a suite of oversold oscillators including RSI, CCI, and Stoch RSI. With dynamic resistance at the Ichimoku Kijun and no long-term support data available, sellers remain firmly in control, and the likelihood of further decline outweighs any near-term rebound potential.


Latest Plasma News


-
 Afghanistan
-
 Albania
-
 Algeria
-
 Angola
-
 Argentina
-
 Armenia
-
 Australia
-
 Austria
-
 Azerbaijan
-
 Bahamas
-
 Bahrain
-
 Bangladesh
-
 Belarus
-
 Belgium
-
 Bolivia
-
 Botswana
-
 Brazil
-
 Brunei
-
 Bulgaria
-
 Cambodia
-
 Cameroon
-
 Canada
-
 Chile
Chile
-
 China
China
-
 Colombia
-
 Congo
Congo
-
 Costa Rica
-
 Cote d'Ivoire
-
 Croatia
-
 Cuba
Cuba
-
 Cyprus
-
 Czechia
-
 DR Congo
-
 Denmark
-
 Dominican Republic
-
 Ecuador
-
 Egypt
Egypt
-
 El Salvador
-
 Estonia
-
 Eswatini
-
 Ethiopia
-
 Finland
-
 France
-
 Georgia
-
 Germany
-
 Ghana
Ghana
-
 Greece
-
 Haiti
Haiti
-
 Hong Kong
-
 Hungary
-
 India
India
-
 Indonesia
-
 Iran, Islamic republic
-
 Iraq
Iraq
-
 Ireland
-
 Israel
-
 Italy
Italy
-
 Jamaica
-
 Japan
Japan
-
 Jordan
-
 Kazakhstan
-
 Kenya
Kenya
-
 Korea
Korea
-
 Kuwait
-
 Kyrgyzstan
-
 Laos
Laos
-
 Latvia
-
 Lebanon
-
 Lesotho
-
 Libya
Libya
-
 Lithuania
-
 Luxembourg
-
 Madagascar
-
 Malaysia
-
 Malta
Malta
-
 Mauritius
-
 Mexico
-
 Moldova
-
 Mongolia
-
 Montenegro
-
 Morocco
-
 Mozambique
-
 Myanmar
-
 Namibia
-
 Nepal
Nepal
-
 Netherlands
-
 New Zealand
-
 Nigeria
-
 North Macedonia
-
 Norway
-
 Oman
Oman
-
 Pakistan
-
 Palestine
-
 Panama
-
 Papua New Guinea
-
 Paraguay
-
 Peru
Peru
-
 Philippines
-
 Poland
-
 Portugal
-
 Puerto Rico
-
 Qatar
Qatar
-
 Reunion
-
 Romania
-
 Rwanda
-
 Saudi Arabia
-
 Serbia
-
 Singapore
-
 Slovakia
-
 Slovenia
-
 Somalia
-
 South Africa
-
 Spain
Spain
-
 Sri Lanka
-
 Sweden
-
 Switzerland
-
 Syria
Syria
-
 Taiwan
-
 Tajikistan
-
 Tanzania
-
 Thailand
-
 Trinidad and Tobago
-
 Tunisia
-
 Turkey
-
 UAE
UAE
-
 Uganda
-
 Ukraine
-
 United Kingdom
-
United States
-
 Uruguay
-
 Uzbekistan
-
 Venezuela
-
 Vietnam
-
 Yemen
Yemen
-
 Zambia
-
 Zimbabwe
- Forex
- Crypto
