
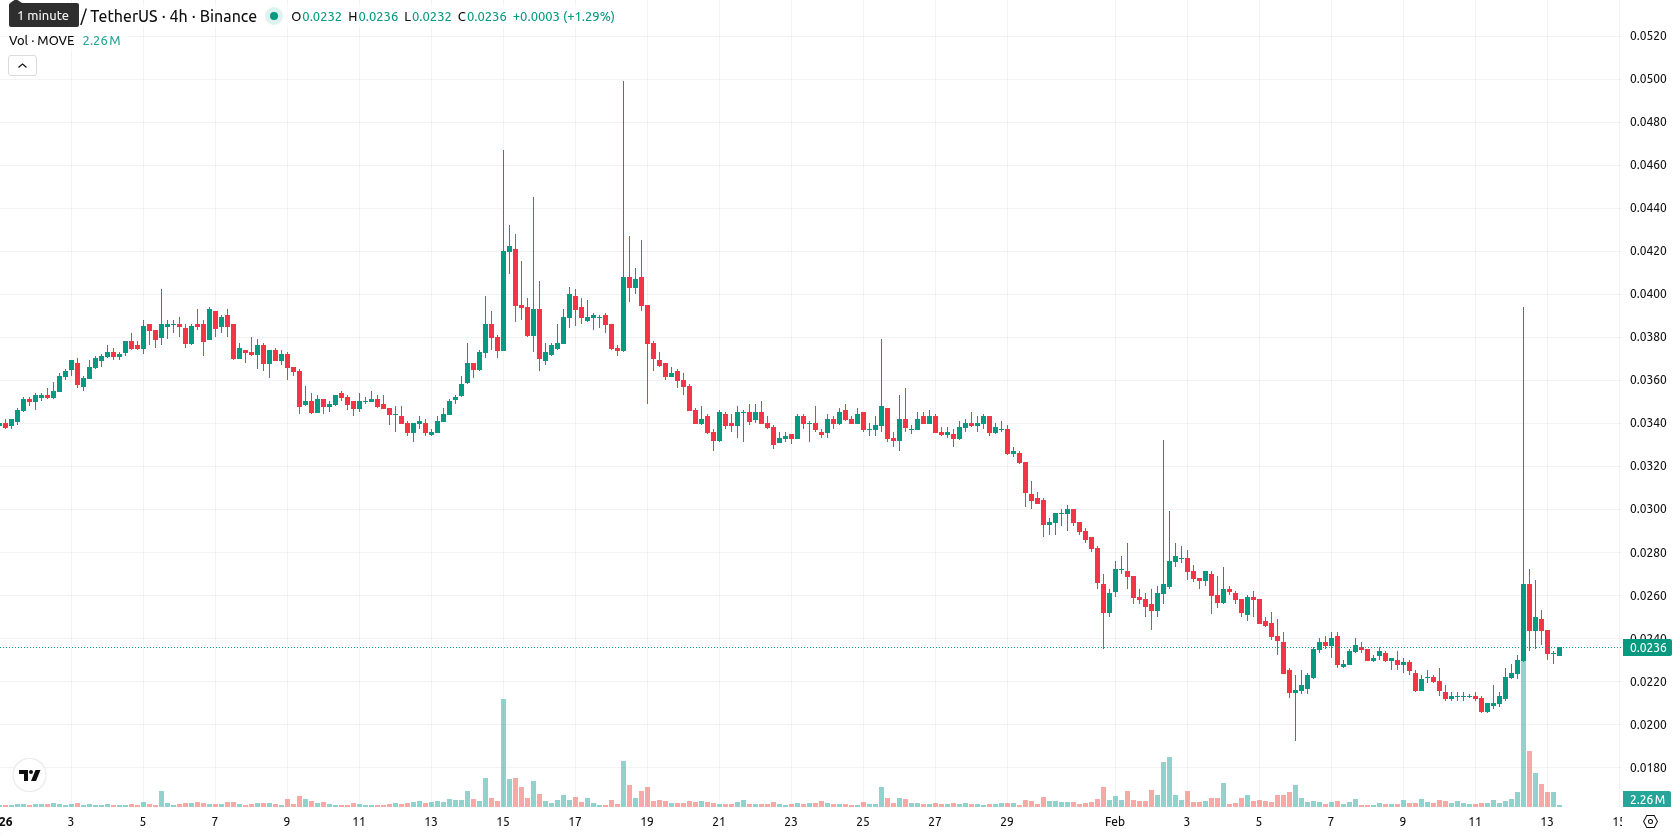
Movement drops after failing to hold technical support and volatility soars

Movement (MOVE) is trading at $0.0235, below the MA-20 ($0.0271), MA-50 ($0.0325), and MA-200 ($0.0760), highlighting persistent pressure from sellers across short, medium, and long-term trends. The next key resistance is the Ichimoku Kijun at $0.0346, while near-term support sits around the MA-5 ($0.0225).
Highlights
- MOVE trades at $0.0235, below MA-20 ($0.0271), MA-50 ($0.0325), and MA-200 ($0.0760), signaling persistent downward pressure across all timeframes.
- Daily MACD signals strong sell and RSI is bearish (40.17), indicating weakness, while Stochastic RSI is overbought (100.00), revealing significant short-term uncertainty.
- Range expected between $0.0225 support (MA-5) and $0.0255 resistance for the next five sessions, with less than 20% probability of price increase.
Diverging momentum indicators fuel uncertainty amid intraday losses
Momentum signals are mixed: the daily MACD shows strong sell and ADX is neutral, pointing to a lack of clear directional strength. The Relative Strength Index signals sell (40.17), and Stochastic RSI is overbought (100.00), while Commodity Channel Index is neutral — this divergence hints at underlying uncertainty. Bull/Bear Power is marginally positive, indicating slight buyer interest intraday, but the daily session slipped 7.11% (no gap at open), with the current price near today’s low ($0.0228), marking high volatility and clear pressure after the opening.
Decline risk elevated as sideways range persists on weak momentum
For the next five sessions, MOVE is likely to range between $0.0225 and $0.0255. The probability of a price increase is very low (less than 20%), making further declines more likely. The baseline scenario is continued sideways consolidation near current levels. A bullish scenario could see price testing above $0.0255 if momentum quickly improves, while a bearish break below $0.0225 would signal renewed selling as both weekly and daily momentum indicators remain skewed toward weakness.
Previously it was reported that MOVE remains under persistent bearish pressure, trading below all major moving averages, with resistance at the Ichimoku Kijun and no immediate support indicated. Daily technical indicators present mixed signals—MACD bearish, ADX weak, and multiple oscillators near oversold—yet overall sentiment continues to favor sellers and further declines remain likely unless a breakout above key resistance occurs.


-
 Afghanistan
-
 Albania
-
 Algeria
-
 Angola
-
 Argentina
-
 Armenia
-
 Australia
-
 Austria
-
 Azerbaijan
-
 Bahamas
-
 Bahrain
-
 Bangladesh
-
 Belarus
-
 Belgium
-
 Bolivia
-
 Botswana
-
 Brazil
-
 Brunei
-
 Bulgaria
-
 Cambodia
-
 Cameroon
-
 Canada
-
 Chile
Chile
-
 China
China
-
 Colombia
-
 Congo
Congo
-
 Costa Rica
-
 Cote d'Ivoire
-
 Croatia
-
 Cuba
Cuba
-
 Cyprus
-
 Czechia
-
 DR Congo
-
 Denmark
-
 Dominican Republic
-
 Ecuador
-
 Egypt
Egypt
-
 El Salvador
-
 Estonia
-
 Eswatini
-
 Ethiopia
-
 Finland
-
 France
-
 Georgia
-
 Germany
-
 Ghana
Ghana
-
 Greece
-
 Haiti
Haiti
-
 Hong Kong
-
 Hungary
-
 India
India
-
 Indonesia
-
 Iran, Islamic republic
-
 Iraq
Iraq
-
 Ireland
-
 Israel
-
 Italy
Italy
-
 Jamaica
-
 Japan
Japan
-
 Jordan
-
 Kazakhstan
-
 Kenya
Kenya
-
 Korea
Korea
-
 Kuwait
-
 Kyrgyzstan
-
 Laos
Laos
-
 Latvia
-
 Lebanon
-
 Lesotho
-
 Libya
Libya
-
 Lithuania
-
 Luxembourg
-
 Madagascar
-
 Malaysia
-
 Malta
Malta
-
 Mauritius
-
 Mexico
-
 Moldova
-
 Mongolia
-
 Montenegro
-
 Morocco
-
 Mozambique
-
 Myanmar
-
 Namibia
-
 Nepal
Nepal
-
 Netherlands
-
 New Zealand
-
 Nigeria
-
 North Macedonia
-
 Norway
-
 Oman
Oman
-
 Pakistan
-
 Palestine
-
 Panama
-
 Papua New Guinea
-
 Paraguay
-
 Peru
Peru
-
 Philippines
-
 Poland
-
 Portugal
-
 Puerto Rico
-
 Qatar
Qatar
-
 Reunion
-
 Romania
-
 Rwanda
-
 Saudi Arabia
-
 Serbia
-
 Singapore
-
 Slovakia
-
 Slovenia
-
 Somalia
-
 South Africa
-
 Spain
Spain
-
 Sri Lanka
-
 Sweden
-
 Switzerland
-
 Syria
Syria
-
 Taiwan
-
 Tajikistan
-
 Tanzania
-
 Thailand
-
 Trinidad and Tobago
-
 Tunisia
-
 Turkey
-
 UAE
UAE
-
 Uganda
-
 Ukraine
-
 United Kingdom
-
United States
-
 Uruguay
-
 Uzbekistan
-
 Venezuela
-
 Vietnam
-
 Yemen
Yemen
-
 Zambia
-
 Zimbabwe
- Forex
- Crypto
