
+10.88% for Morpho — volatility and key support drive upward move

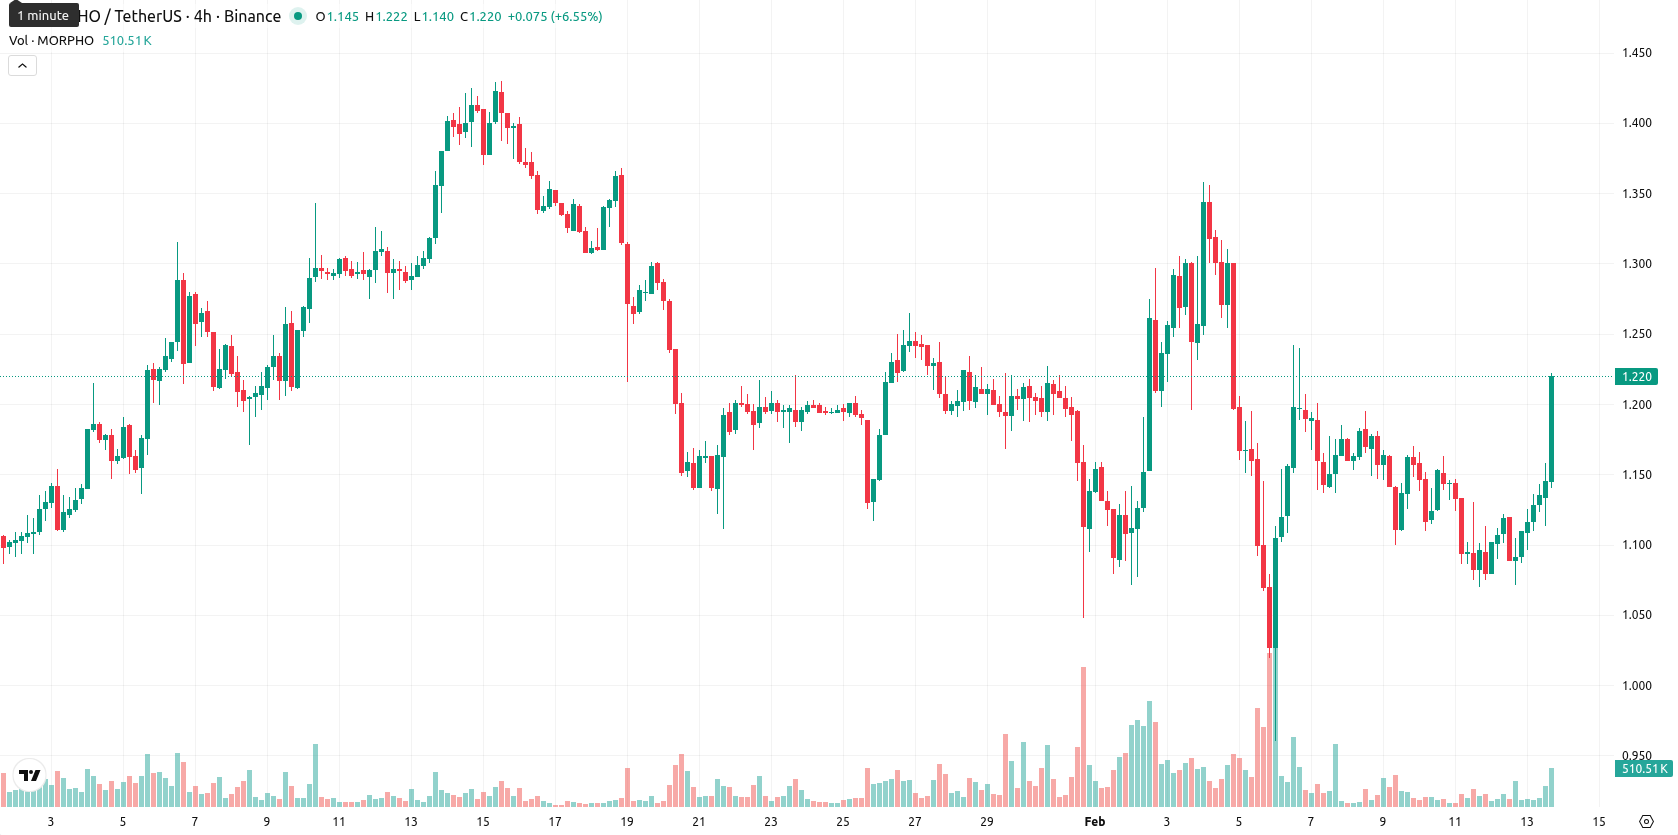
Morpho (MORPHO) is trading at $1.213, above its MA-20 ($1.1690) and MA-50 ($1.2041), but well below the MA-200 ($1.6549). This signals short- and medium-term buying momentum within a broader bearish structure.
Highlights
- MORPHO surged 10.88% to $1.213, trading above its MA-20 ($1.1690) and MA-50 ($1.2041) but remains below the MA-200 ($1.6549), indicating short- and medium-term buying in a longer-term downtrend.
- Momentum indicators show mixed signals: D1 MACD signals 'Sell', ADX (17.65) is neutral, and CCI (–109) is oversold, suggesting uncertain trend strength and limited upside follow-through.
- The next 5-day range is expected between $1.10 and $1.32; sustained gains are unlikely without a breakout above $1.32, while a drop below $1.10 could trigger further declines.
Mixed momentum and resistance hint at lingering bearish pressure
Momentum signals for MORPHO are mixed: the D1 MACD shows a "Sell" while the ADX (neutral, 17.65) indicates weak trend strength. RSI stands at 44.0, Stochastic RSI is on "Buy," and CCI is at –109, signaling an oversold market. Bull/Bear Power signals "Sell" (–0.0282), suggesting sellers still have an edge despite today's upward move. The price is at the upper end of today’s high-volatility range ($1.097 to $1.213), with dynamic support at the Ichimoku Kijun ($1.1625) and resistance at the MA-50 ($1.2041).
Consolidation likely as volatility limits breakout odds
Looking ahead, the expected price range for the next 5 trading days is $1.10–$1.32, reflecting a typical volatility band relative to current levels. Weekly indicators lack "Buy" signals, so there is a low likelihood (less than 20%) of a sustained price increase. The base case is for consolidation between $1.10 and $1.32. A breakout above $1.32 could open up further upside, while a move below $1.10 would indicate renewed selling pressure.
Previously it was reported that Morpho (MORPHO) is showing tentative short- and medium-term recovery, trading above its 20- and 50-day moving averages but remaining in an overall long-term downtrend beneath the 200-day average. Key indicators present mixed signals with improving but still negative MACD, weak ADX, a low RSI, and converging resistance and support levels, suggesting continued consolidation and limited momentum for a sustained breakout.


-
 Afghanistan
-
 Albania
-
 Algeria
-
 Angola
-
 Argentina
-
 Armenia
-
 Australia
-
 Austria
-
 Azerbaijan
-
 Bahamas
-
 Bahrain
-
 Bangladesh
-
 Belarus
-
 Belgium
-
 Bolivia
-
 Botswana
-
 Brazil
-
 Brunei
-
 Bulgaria
-
 Cambodia
-
 Cameroon
-
 Canada
-
 Chile
Chile
-
 China
China
-
 Colombia
-
 Congo
Congo
-
 Costa Rica
-
 Cote d'Ivoire
-
 Croatia
-
 Cuba
Cuba
-
 Cyprus
-
 Czechia
-
 DR Congo
-
 Denmark
-
 Dominican Republic
-
 Ecuador
-
 Egypt
Egypt
-
 El Salvador
-
 Estonia
-
 Eswatini
-
 Ethiopia
-
 Finland
-
 France
-
 Georgia
-
 Germany
-
 Ghana
Ghana
-
 Greece
-
 Haiti
Haiti
-
 Hong Kong
-
 Hungary
-
 India
India
-
 Indonesia
-
 Iran, Islamic republic
-
 Iraq
Iraq
-
 Ireland
-
 Israel
-
 Italy
Italy
-
 Jamaica
-
 Japan
Japan
-
 Jordan
-
 Kazakhstan
-
 Kenya
Kenya
-
 Korea
Korea
-
 Kuwait
-
 Kyrgyzstan
-
 Laos
Laos
-
 Latvia
-
 Lebanon
-
 Lesotho
-
 Libya
Libya
-
 Lithuania
-
 Luxembourg
-
 Madagascar
-
 Malaysia
-
 Malta
Malta
-
 Mauritius
-
 Mexico
-
 Moldova
-
 Mongolia
-
 Montenegro
-
 Morocco
-
 Mozambique
-
 Myanmar
-
 Namibia
-
 Nepal
Nepal
-
 Netherlands
-
 New Zealand
-
 Nigeria
-
 North Macedonia
-
 Norway
-
 Oman
Oman
-
 Pakistan
-
 Palestine
-
 Panama
-
 Papua New Guinea
-
 Paraguay
-
 Peru
Peru
-
 Philippines
-
 Poland
-
 Portugal
-
 Puerto Rico
-
 Qatar
Qatar
-
 Reunion
-
 Romania
-
 Rwanda
-
 Saudi Arabia
-
 Serbia
-
 Singapore
-
 Slovakia
-
 Slovenia
-
 Somalia
-
 South Africa
-
 Spain
Spain
-
 Sri Lanka
-
 Sweden
-
 Switzerland
-
 Syria
Syria
-
 Taiwan
-
 Tajikistan
-
 Tanzania
-
 Thailand
-
 Trinidad and Tobago
-
 Tunisia
-
 Turkey
-
 UAE
UAE
-
 Uganda
-
 Ukraine
-
 United Kingdom
-
United States
-
 Uruguay
-
 Uzbekistan
-
 Venezuela
-
 Vietnam
-
 Yemen
Yemen
-
 Zambia
-
 Zimbabwe
- Forex
- Crypto
