
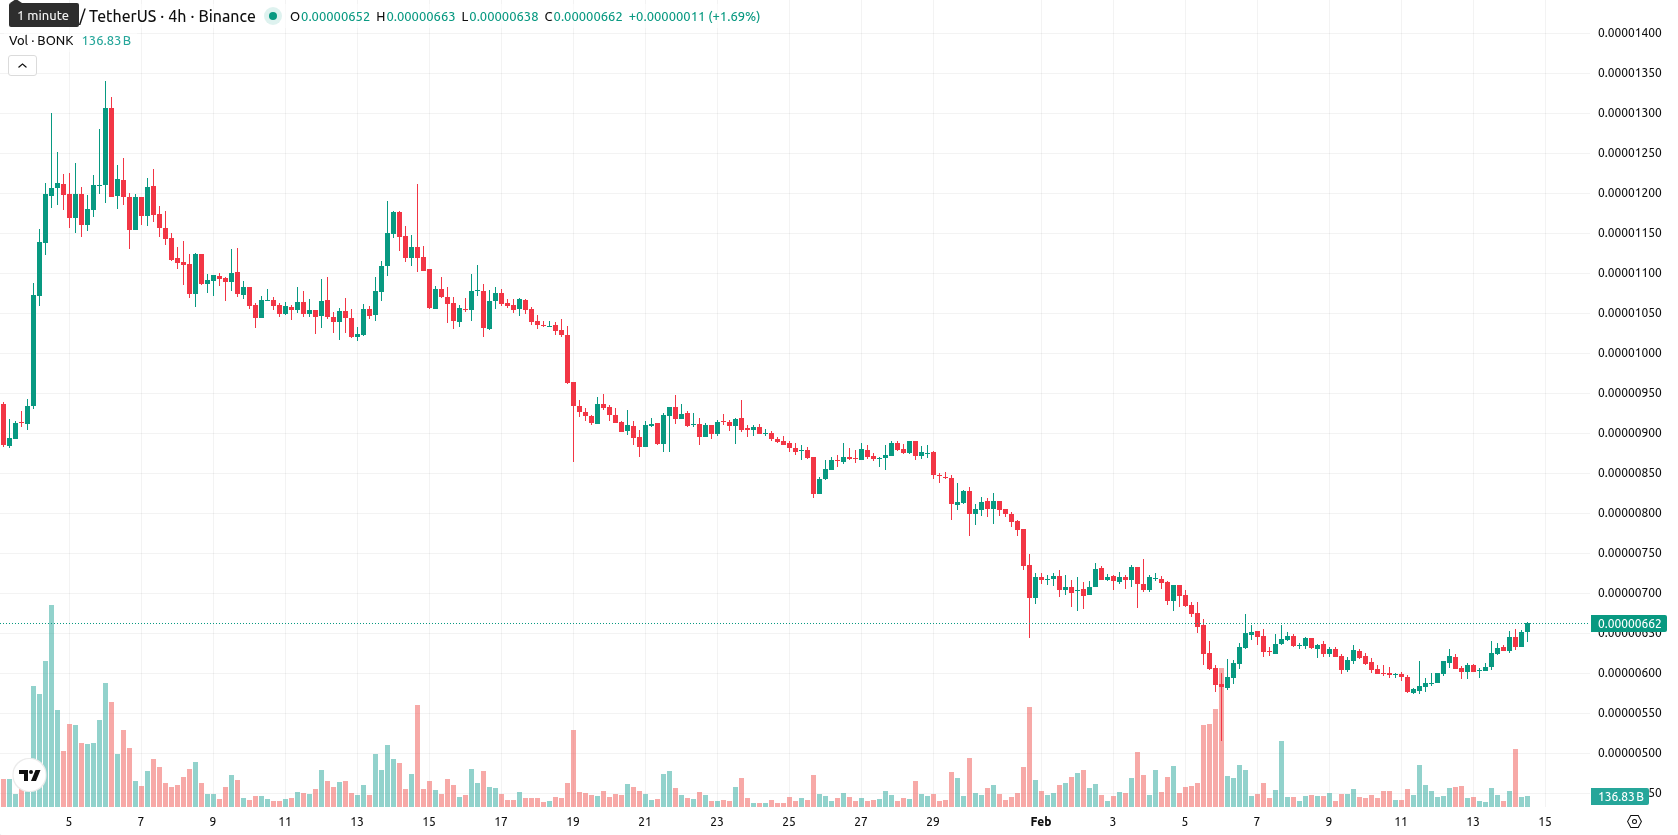
Bonk gains 7.83% as Solana ecosystem integration continues despite weak momentum signals

Bonk (BONK) is trading at $0.0000066, currently below its MA-20 ($0.00000710), MA-50 ($0.00000868), and MA-200 ($0.00001485) levels, reflecting sustained daily downward pressure. This positioning underscores clear weakness relative to key short, medium, and long-term moving averages.
Highlights
- Bonk is expanding beyond its airdrop roots through deeper integration and utility development in the Solana ecosystem, aiming for broader community engagement.
- Ecosystem involvement and increasing exchange adoption are key drivers behind Bonk's evolving trajectory, though persistent volatility continues to influence sentiment.
- BONK trades at $0.0000066 below key moving averages, with resistance at $0.00000739 and support near $0.0000060, while technical indicators signal a sustained bearish bias.
Ecosystem growth and volatility as adoption shapes Bonk’s path
Bonk, a dog-themed memecoin, is continuing its development within the Solana ecosystem as it seeks further integration beyond its origins as an airdrop-driven project. The token’s ongoing engagement with the Solana community and efforts to expand its utility are central to its current trajectory. Ecosystem involvement and growing exchange adoption are shaping Bonk’s evolution, while general volatility remains a factor affecting sentiment.
Bearish bias and overbought signals complicate technical patterns
Technical analysis indicates that BONK is trading below all major moving averages, warning of sustained negative trends across time frames. The closest dynamic resistance is positioned at the Ichimoku Kijun at $0.00000739, with immediate support likely near the short-term moving averages. Leading momentum indicators such as the MACD and ADX maintain a bearish bias, while the RSI and Commodity Channel Index confirm weak momentum. The Stochastic RSI is deeply overbought, suggesting short-term exhaustion for buyers, whereas Bull/Bear Power data signals seller dominance intraday, despite strong session highs and volatility. Discrepancy between the robust daily move and persistently bearish signals and oversold oscillators adds complexity to the technical outlook.
Consolidation likely as muted momentum limits bullish potential
In the short term, the expected volatility band for BONK is between $0.0000060 and $0.0000070, with further downside more probable due to the muted buy signals in weekly trend indicators. The baseline scenario suggests sideways consolidation just above the recent support level. A bullish break over $0.0000074 could indicate a trend reversal and open limited upside, while a drop below $0.0000060 might trigger deeper declines toward new support.
Previously it was reported that Bonk is trading well below all key moving averages with strong downside momentum confirmed by bearish MACD and ADX readings, while oversold RSI and CCI readings indicate limited potential for a short-term technical rebound. Resistance is defined by the Ichimoku Kijun, and unless BONK breaks above its projected upper volatility band, further consolidation or downside is expected.


-
 Afghanistan
-
 Albania
-
 Algeria
-
 Angola
-
 Argentina
-
 Armenia
-
 Australia
-
 Austria
-
 Azerbaijan
-
 Bahamas
-
 Bahrain
-
 Bangladesh
-
 Belarus
-
 Belgium
-
 Bolivia
-
 Botswana
-
 Brazil
-
 Brunei
-
 Bulgaria
-
 Cambodia
-
 Cameroon
-
 Canada
-
 Chile
Chile
-
 China
China
-
 Colombia
-
 Congo
Congo
-
 Costa Rica
-
 Cote d'Ivoire
-
 Croatia
-
 Cuba
Cuba
-
 Cyprus
-
 Czechia
-
 DR Congo
-
 Denmark
-
 Dominican Republic
-
 Ecuador
-
 Egypt
Egypt
-
 El Salvador
-
 Estonia
-
 Eswatini
-
 Ethiopia
-
 Finland
-
 France
-
 Georgia
-
 Germany
-
 Ghana
Ghana
-
 Greece
-
 Haiti
Haiti
-
 Hong Kong
-
 Hungary
-
 India
India
-
 Indonesia
-
 Iran, Islamic republic
-
 Iraq
Iraq
-
 Ireland
-
 Israel
-
 Italy
Italy
-
 Jamaica
-
 Japan
Japan
-
 Jordan
-
 Kazakhstan
-
 Kenya
Kenya
-
 Korea
Korea
-
 Kuwait
-
 Kyrgyzstan
-
 Laos
Laos
-
 Latvia
-
 Lebanon
-
 Lesotho
-
 Libya
Libya
-
 Lithuania
-
 Luxembourg
-
 Madagascar
-
 Malaysia
-
 Malta
Malta
-
 Mauritius
-
 Mexico
-
 Moldova
-
 Mongolia
-
 Montenegro
-
 Morocco
-
 Mozambique
-
 Myanmar
-
 Namibia
-
 Nepal
Nepal
-
 Netherlands
-
 New Zealand
-
 Nigeria
-
 North Macedonia
-
 Norway
-
 Oman
Oman
-
 Pakistan
-
 Palestine
-
 Panama
-
 Papua New Guinea
-
 Paraguay
-
 Peru
Peru
-
 Philippines
-
 Poland
-
 Portugal
-
 Puerto Rico
-
 Qatar
Qatar
-
 Reunion
-
 Romania
-
 Rwanda
-
 Saudi Arabia
-
 Serbia
-
 Singapore
-
 Slovakia
-
 Slovenia
-
 Somalia
-
 South Africa
-
 Spain
Spain
-
 Sri Lanka
-
 Sweden
-
 Switzerland
-
 Syria
Syria
-
 Taiwan
-
 Tajikistan
-
 Tanzania
-
 Thailand
-
 Trinidad and Tobago
-
 Tunisia
-
 Turkey
-
 UAE
UAE
-
 Uganda
-
 Ukraine
-
 United Kingdom
-
United States
-
 Uruguay
-
 Uzbekistan
-
 Venezuela
-
 Vietnam
-
 Yemen
Yemen
-
 Zambia
-
 Zimbabwe
- Forex
- Crypto
