
IOTA: Mixed oscillators and defined downtrend drive a 7.22% gain

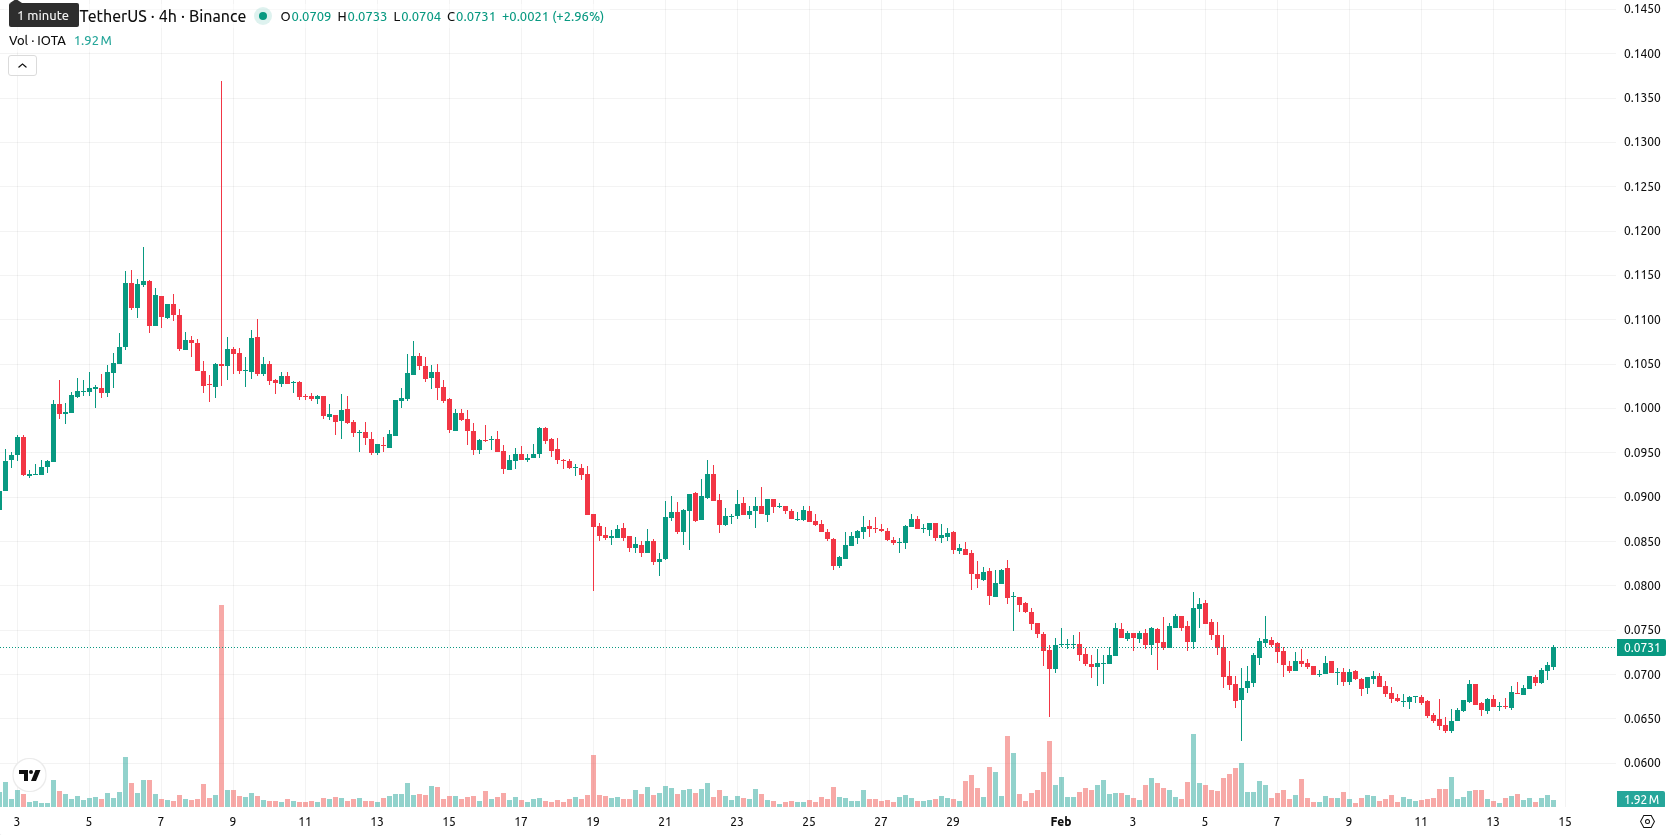
IOTA (IOTA) is trading at $0.0733, which is slightly below the MA-20 ($0.0745) and well under the medium- and long-term MA-50 ($0.0861) and MA-200 ($0.1384), signaling persistent seller pressure across all timeframes.
Highlights
- IOTA trades at $0.0733, below the MA-20, MA-50, and MA-200, signaling persistent selling pressure across all timeframes.
- Bearish momentum dominates as daily MACD issues a strong sell and ADX at 28 confirms a moderately defined downtrend, with RSI at 39.2 and CCI at -76.4.
- Near-term resistance sits at the Ichimoku Kijun ($0.0780) and further decline is likely unless $0.0780 is breached, with downside risk below $0.0660.
Mixed oscillator signals as resistance meets entrenched downside momentum
The nearest dynamic resistance is at the Ichimoku Kijun ($0.0780), with no indication of a golden or death cross. Momentum signals on the daily chart tilt negative, with the MACD giving a strong sell and the ADX at 28 suggesting a moderately defined downtrend. Oscillators highlight mixed conditions: the RSI (39.2) and CCI (-76.4) are in bearish territory, while the Stochastic RSI reads overbought, creating a notable divergence. Bull/Bear Power remains negative, pointing to ongoing dominance by sellers intraday, while the Awesome Oscillator is neutral.
Bearish tilt prevails as upside potential remains limited
For the next week, the expected trading range for IOTA is normalized to $0.0660 to $0.0800 to reflect both the current price and possible volatility. The probability of a further rise is very low (less than 20%), making a decline more likely given continued bearish signals from all weekly indicators. Baseline scenario: IOTA drifts sideways between $0.0660 and $0.0800. Bullish scenario: a strong push above the Ichimoku Kijun at $0.0780 could open short-term upside toward $0.0800, while a drop below $0.0660 would confirm further downside as sellers maintain control.
Previously it was reported that IOTA remains below its key moving averages, with the current price action showing an intraday surge but still struggling beneath established resistance at the Ichimoku Kijun and only weak, unconfirmed support. Momentum indicators including the MACD and ADX confirm a prevailing bearish trend, while daily oscillators highlight oversold conditions, suggesting any short-term rebound remains unconfirmed within the broader downtrend.


Latest IOTA News


-
 Afghanistan
-
 Albania
-
 Algeria
-
 Angola
-
 Argentina
-
 Armenia
-
 Australia
-
 Austria
-
 Azerbaijan
-
 Bahamas
-
 Bahrain
-
 Bangladesh
-
 Belarus
-
 Belgium
-
 Bolivia
-
 Botswana
-
 Brazil
-
 Brunei
-
 Bulgaria
-
 Cambodia
-
 Cameroon
-
 Canada
-
 Chile
Chile
-
 China
China
-
 Colombia
-
 Congo
Congo
-
 Costa Rica
-
 Cote d'Ivoire
-
 Croatia
-
 Cuba
Cuba
-
 Cyprus
-
 Czechia
-
 DR Congo
-
 Denmark
-
 Dominican Republic
-
 Ecuador
-
 Egypt
Egypt
-
 El Salvador
-
 Estonia
-
 Eswatini
-
 Ethiopia
-
 Finland
-
 France
-
 Georgia
-
 Germany
-
 Ghana
Ghana
-
 Greece
-
 Haiti
Haiti
-
 Hong Kong
-
 Hungary
-
 India
India
-
 Indonesia
-
 Iran, Islamic republic
-
 Iraq
Iraq
-
 Ireland
-
 Israel
-
 Italy
Italy
-
 Jamaica
-
 Japan
Japan
-
 Jordan
-
 Kazakhstan
-
 Kenya
Kenya
-
 Korea
Korea
-
 Kuwait
-
 Kyrgyzstan
-
 Laos
Laos
-
 Latvia
-
 Lebanon
-
 Lesotho
-
 Libya
Libya
-
 Lithuania
-
 Luxembourg
-
 Madagascar
-
 Malaysia
-
 Malta
Malta
-
 Mauritius
-
 Mexico
-
 Moldova
-
 Mongolia
-
 Montenegro
-
 Morocco
-
 Mozambique
-
 Myanmar
-
 Namibia
-
 Nepal
Nepal
-
 Netherlands
-
 New Zealand
-
 Nigeria
-
 North Macedonia
-
 Norway
-
 Oman
Oman
-
 Pakistan
-
 Palestine
-
 Panama
-
 Papua New Guinea
-
 Paraguay
-
 Peru
Peru
-
 Philippines
-
 Poland
-
 Portugal
-
 Puerto Rico
-
 Qatar
Qatar
-
 Reunion
-
 Romania
-
 Rwanda
-
 Saudi Arabia
-
 Serbia
-
 Singapore
-
 Slovakia
-
 Slovenia
-
 Somalia
-
 South Africa
-
 Spain
Spain
-
 Sri Lanka
-
 Sweden
-
 Switzerland
-
 Syria
Syria
-
 Taiwan
-
 Tajikistan
-
 Tanzania
-
 Thailand
-
 Trinidad and Tobago
-
 Tunisia
-
 Turkey
-
 UAE
UAE
-
 Uganda
-
 Ukraine
-
 United Kingdom
-
United States
-
 Uruguay
-
 Uzbekistan
-
 Venezuela
-
 Vietnam
-
 Yemen
Yemen
-
 Zambia
-
 Zimbabwe
- Forex
- Crypto
