
Render gains 7.07% as price rallies from near-term lows despite mixed technical signals

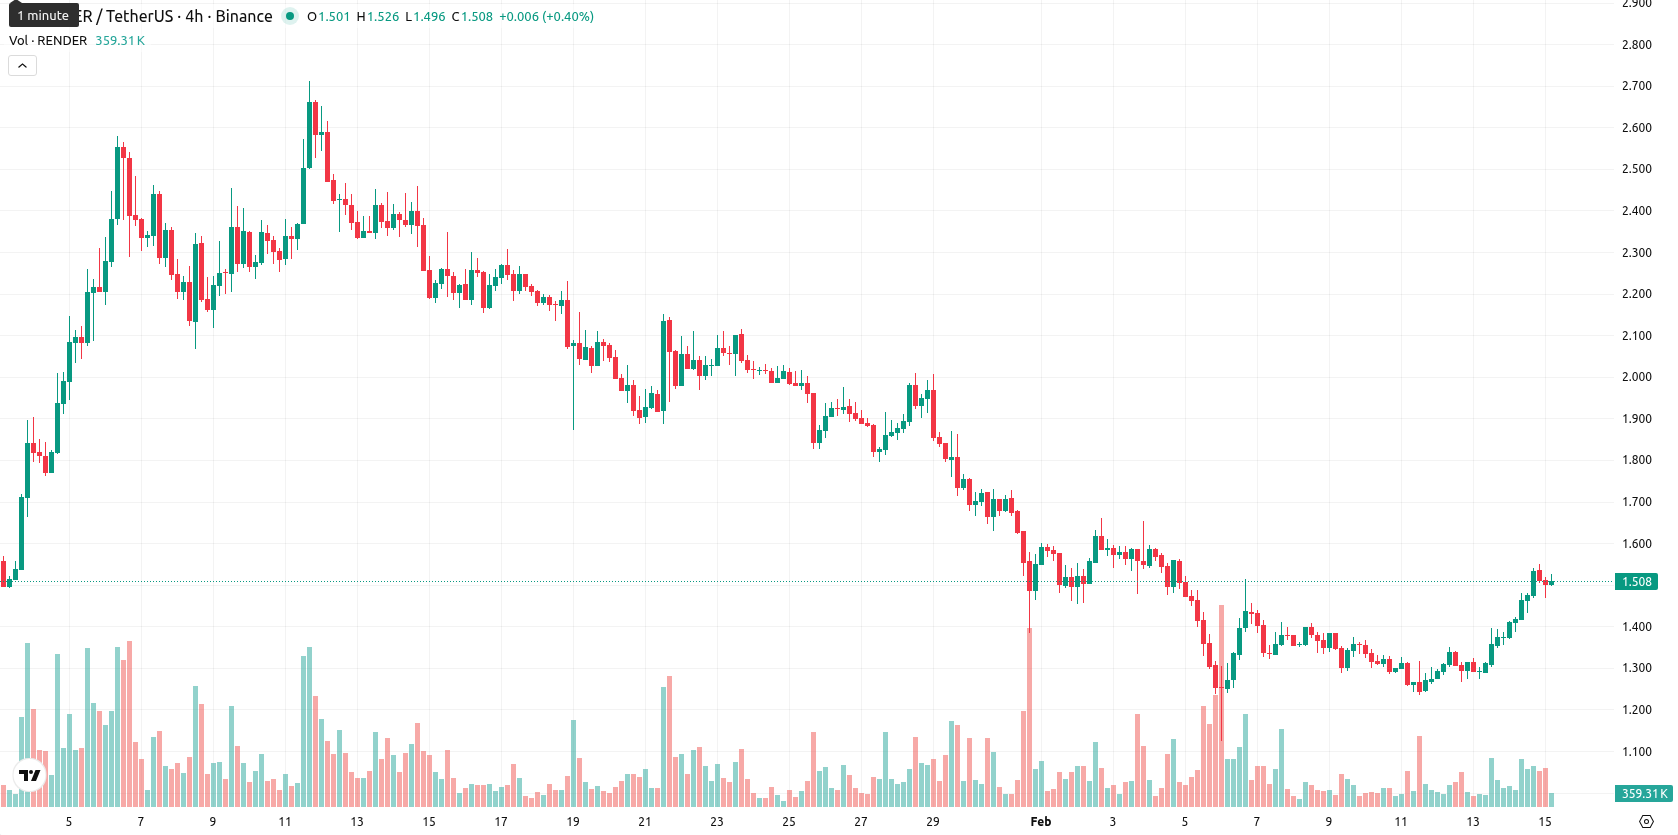
Render (RENDER) is trading below both the MA-20 ($1.5202) and MA-50 ($1.7901), as well as well under the MA-200 ($2.5399), which indicates short-, medium-, and long-term pressure from sellers with no longer-term structural support nearby.
Highlights
- Render is experiencing increasing accumulation signals and rising trading volumes across spot and futures, led by increased whale orders and a weaker dollar.
- Participation remains moderated due to broader cryptocurrency market pressure, despite short-term spikes in activity.
- Render trades at $1.50, under the MA-20, MA-50, and MA-200, facing resistance at $1.6375 with a projected consolidation range of $1.44 to $1.62.
Rising accumulation and whale interest follow increased trading volumes
Accumulation signals for Render are increasing, supported by a noticeable rise in trading volume across spot and futures markets. This trend is being driven in part by increased whale orders, while broader cryptocurrency market pressure continues to affect participation. The recent weakness in the dollar has contributed to greater activity for Render.
Mixed technical signals as support erodes and momentum weakens
The nearest dynamic support is around the Ichimoku Kijun ($1.6375) as resistance, while there is no support from the 50- or 200-day Moving Averages at these levels, highlighting vulnerability below $1.50. Momentum signals on the daily chart are mixed: the MACD issues a strong sell and the ADX suggests a trend losing strength, while the RSI (47.0) and Commodity Channel Index (−17.4) remain neutral to slightly bearish, and the Stochastic RSI flags overbought conditions. Bull/Bear Power indicates strong buyer pressure intraday, with the current price near the upper part of today’s range ($1.467 – $1.526), and the session shows moderate volatility with firm upward momentum after the open, but underlying indicator divergence raises caution for sustainability.
Limited breakout odds as indicators favor sideways consolidation
For the next five trading days, the expected price range for RENDER is $1.44 to $1.62, consistent with typical volatility and current price action. There is a very low probability (less than 20%) of a sustained upward breakout based on the uniformly negative signals from weekly MACD, ADX, RSI, and 50-day Moving Average. The baseline scenario is for RENDER to consolidate sideways between $1.44 and $1.62. A potential bullish case would require a clear breakout above $1.64 with intraday momentum confirmation, while a bearish scenario could see the price slip below $1.44 if selling returns and short-term indicators turn lower.
Previously it was reported that Render (RNDR) continues to trade below all key moving averages, underscoring persistent seller pressure across short, medium, and long-term trends, with price action trapped beneath dynamic resistance. Momentum indicators remain mixed—while daily MACD and RSI suggest bearish, slightly oversold conditions, oscillators are conflicted, pointing to heightened volatility and potential for either further downside or consolidation near current levels.


-
 Afghanistan
-
 Albania
-
 Algeria
-
 Angola
-
 Argentina
-
 Armenia
-
 Australia
-
 Austria
-
 Azerbaijan
-
 Bahamas
-
 Bahrain
-
 Bangladesh
-
 Belarus
-
 Belgium
-
 Bolivia
-
 Botswana
-
 Brazil
-
 Brunei
-
 Bulgaria
-
 Cambodia
-
 Cameroon
-
 Canada
-
 Chile
Chile
-
 China
China
-
 Colombia
-
 Congo
Congo
-
 Costa Rica
-
 Cote d'Ivoire
-
 Croatia
-
 Cuba
Cuba
-
 Cyprus
-
 Czechia
-
 DR Congo
-
 Denmark
-
 Dominican Republic
-
 Ecuador
-
 Egypt
Egypt
-
 El Salvador
-
 Estonia
-
 Eswatini
-
 Ethiopia
-
 Finland
-
 France
-
 Georgia
-
 Germany
-
 Ghana
Ghana
-
 Greece
-
 Haiti
Haiti
-
 Hong Kong
-
 Hungary
-
 India
India
-
 Indonesia
-
 Iran, Islamic republic
-
 Iraq
Iraq
-
 Ireland
-
 Israel
-
 Italy
Italy
-
 Jamaica
-
 Japan
Japan
-
 Jordan
-
 Kazakhstan
-
 Kenya
Kenya
-
 Korea
Korea
-
 Kuwait
-
 Kyrgyzstan
-
 Laos
Laos
-
 Latvia
-
 Lebanon
-
 Lesotho
-
 Libya
Libya
-
 Lithuania
-
 Luxembourg
-
 Madagascar
-
 Malaysia
-
 Malta
Malta
-
 Mauritius
-
 Mexico
-
 Moldova
-
 Mongolia
-
 Montenegro
-
 Morocco
-
 Mozambique
-
 Myanmar
-
 Namibia
-
 Nepal
Nepal
-
 Netherlands
-
 New Zealand
-
 Nigeria
-
 North Macedonia
-
 Norway
-
 Oman
Oman
-
 Pakistan
-
 Palestine
-
 Panama
-
 Papua New Guinea
-
 Paraguay
-
 Peru
Peru
-
 Philippines
-
 Poland
-
 Portugal
-
 Puerto Rico
-
 Qatar
Qatar
-
 Reunion
-
 Romania
-
 Rwanda
-
 Saudi Arabia
-
 Serbia
-
 Singapore
-
 Slovakia
-
 Slovenia
-
 Somalia
-
 South Africa
-
 Spain
Spain
-
 Sri Lanka
-
 Sweden
-
 Switzerland
-
 Syria
Syria
-
 Taiwan
-
 Tajikistan
-
 Tanzania
-
 Thailand
-
 Trinidad and Tobago
-
 Tunisia
-
 Turkey
-
 UAE
UAE
-
 Uganda
-
 Ukraine
-
 United Kingdom
-
United States
-
 Uruguay
-
 Uzbekistan
-
 Venezuela
-
 Vietnam
-
 Yemen
Yemen
-
 Zambia
-
 Zimbabwe
- Forex
- Crypto
