
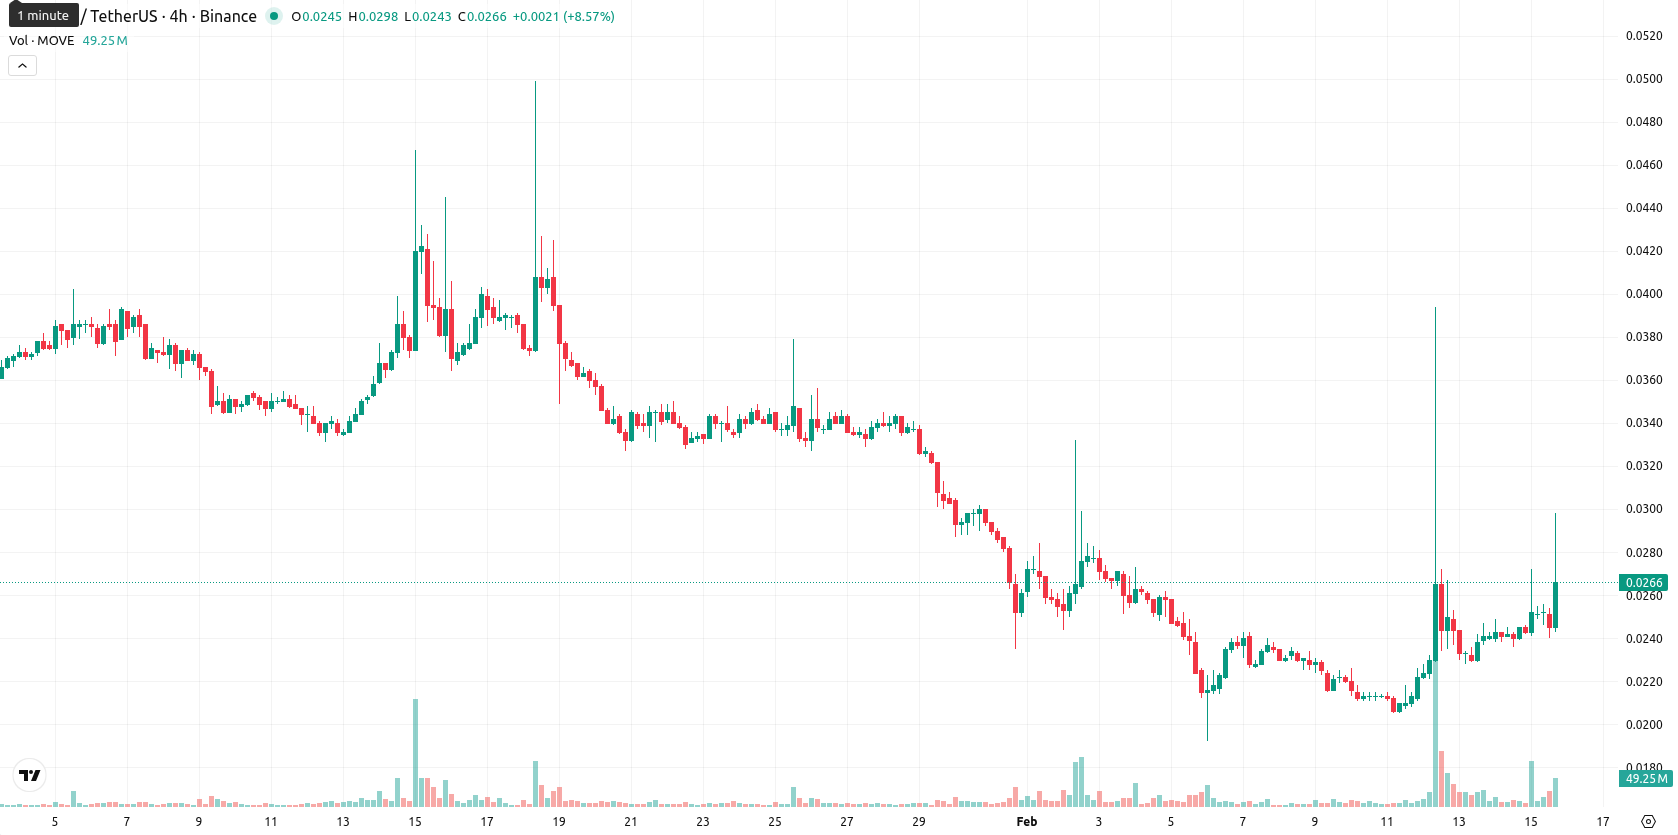
Movement price prediction: Rangebound outlook as MOVE jumps to resistance zone

Movement (MOVE) is trading at $0.0279, positioned above the MA-20 ($0.0261) but still below both MA-50 ($0.0321) and MA-200 ($0.0748). This setup suggests short-term bullish momentum, while medium- and long-term trends remain under pressure from sellers, with the nearest dynamic resistance around the Ichimoku Kijun at $0.0293 and support near the MA-20.
Highlights
- MOVE is trading at $0.0279, up 15.77% intraday, currently above MA-20 ($0.0261) but below both MA-50 ($0.0321) and MA-200 ($0.0748).
- Short-term bullish momentum persists with MOVE approaching dynamic resistance at Ichimoku Kijun ($0.0293), while the trend remains under medium- and long-term selling pressure.
- Technical indicators are mixed: MACD signals downside, Stochastic RSI flags overbought, and forecast calls for consolidation in the $0.0250–$0.0330 range over the next five days.
Intraday strength diverges from overbought signals and neutral trend
Momentum indicators show mixed signals: the MACD on the daily timeframe points to strong downside pressure, yet the ADX indicates a neutral trend and Stochastic RSI flags overbought territory, mirrored by a weak RSI reading near 41 and a neutral Commodity Channel Index. Bull/Bear Power suggests buyers are marginally dominant intraday. The daily price is up 15.77%, moving from an open of $0.0243 to $0.0279, with little to no gap at the open and the price now trading near the high of today's range, reflecting high volatility and pronounced strength toward intraday highs. However, the conflicting signals between overbought oscillators and upward intraday momentum signal divergence, so the current surge is not fully confirmed by broader momentum gauges.
Bearish bias persists as limited upside meets key resistance
For the next five trading days, an adjusted forecast places MOVE in a range of $0.0250 to $0.0330, keeping both extremes within a 20% volatility band relative to current levels. There is a very low probability (less than 20%) of a sustained price increase, making further declines more likely. The baseline scenario sees MOVE consolidating sideways between support and resistance. A bullish scenario would require a decisive close above $0.0293, targeting the $0.0330 area, while a bearish outcome is possible if support at $0.0250 fails, opening the way to further downside.
Previously it was reported that MOVE continues to trade below key moving averages, with the current price remaining under persistent downward pressure and volatility elevated near support. Technical indicators are mixed, as bearish momentum from MACD and subdued RSI contrast with occasional overbought signals from Stoch RSI while sellers dominate and price action remains constrained near daily lows.


-
 Afghanistan
-
 Albania
-
 Algeria
-
 Angola
-
 Argentina
-
 Armenia
-
 Australia
-
 Austria
-
 Azerbaijan
-
 Bahamas
-
 Bahrain
-
 Bangladesh
-
 Belarus
-
 Belgium
-
 Bolivia
-
 Botswana
-
 Brazil
-
 Brunei
-
 Bulgaria
-
 Cambodia
-
 Cameroon
-
 Canada
-
 Chile
Chile
-
 China
China
-
 Colombia
-
 Congo
Congo
-
 Costa Rica
-
 Cote d'Ivoire
-
 Croatia
-
 Cuba
Cuba
-
 Cyprus
-
 Czechia
-
 DR Congo
-
 Denmark
-
 Dominican Republic
-
 Ecuador
-
 Egypt
Egypt
-
 El Salvador
-
 Estonia
-
 Eswatini
-
 Ethiopia
-
 Finland
-
 France
-
 Georgia
-
 Germany
-
 Ghana
Ghana
-
 Greece
-
 Haiti
Haiti
-
 Hong Kong
-
 Hungary
-
 India
India
-
 Indonesia
-
 Iran, Islamic republic
-
 Iraq
Iraq
-
 Ireland
-
 Israel
-
 Italy
Italy
-
 Jamaica
-
 Japan
Japan
-
 Jordan
-
 Kazakhstan
-
 Kenya
Kenya
-
 Korea
Korea
-
 Kuwait
-
 Kyrgyzstan
-
 Laos
Laos
-
 Latvia
-
 Lebanon
-
 Lesotho
-
 Libya
Libya
-
 Lithuania
-
 Luxembourg
-
 Madagascar
-
 Malaysia
-
 Malta
Malta
-
 Mauritius
-
 Mexico
-
 Moldova
-
 Mongolia
-
 Montenegro
-
 Morocco
-
 Mozambique
-
 Myanmar
-
 Namibia
-
 Nepal
Nepal
-
 Netherlands
-
 New Zealand
-
 Nigeria
-
 North Macedonia
-
 Norway
-
 Oman
Oman
-
 Pakistan
-
 Palestine
-
 Panama
-
 Papua New Guinea
-
 Paraguay
-
 Peru
Peru
-
 Philippines
-
 Poland
-
 Portugal
-
 Puerto Rico
-
 Qatar
Qatar
-
 Reunion
-
 Romania
-
 Rwanda
-
 Saudi Arabia
-
 Serbia
-
 Singapore
-
 Slovakia
-
 Slovenia
-
 Somalia
-
 South Africa
-
 Spain
Spain
-
 Sri Lanka
-
 Sweden
-
 Switzerland
-
 Syria
Syria
-
 Taiwan
-
 Tajikistan
-
 Tanzania
-
 Thailand
-
 Trinidad and Tobago
-
 Tunisia
-
 Turkey
-
 UAE
UAE
-
 Uganda
-
 Ukraine
-
 United Kingdom
-
United States
-
 Uruguay
-
 Uzbekistan
-
 Venezuela
-
 Vietnam
-
 Yemen
Yemen
-
 Zambia
-
 Zimbabwe
- Forex
- Crypto
