
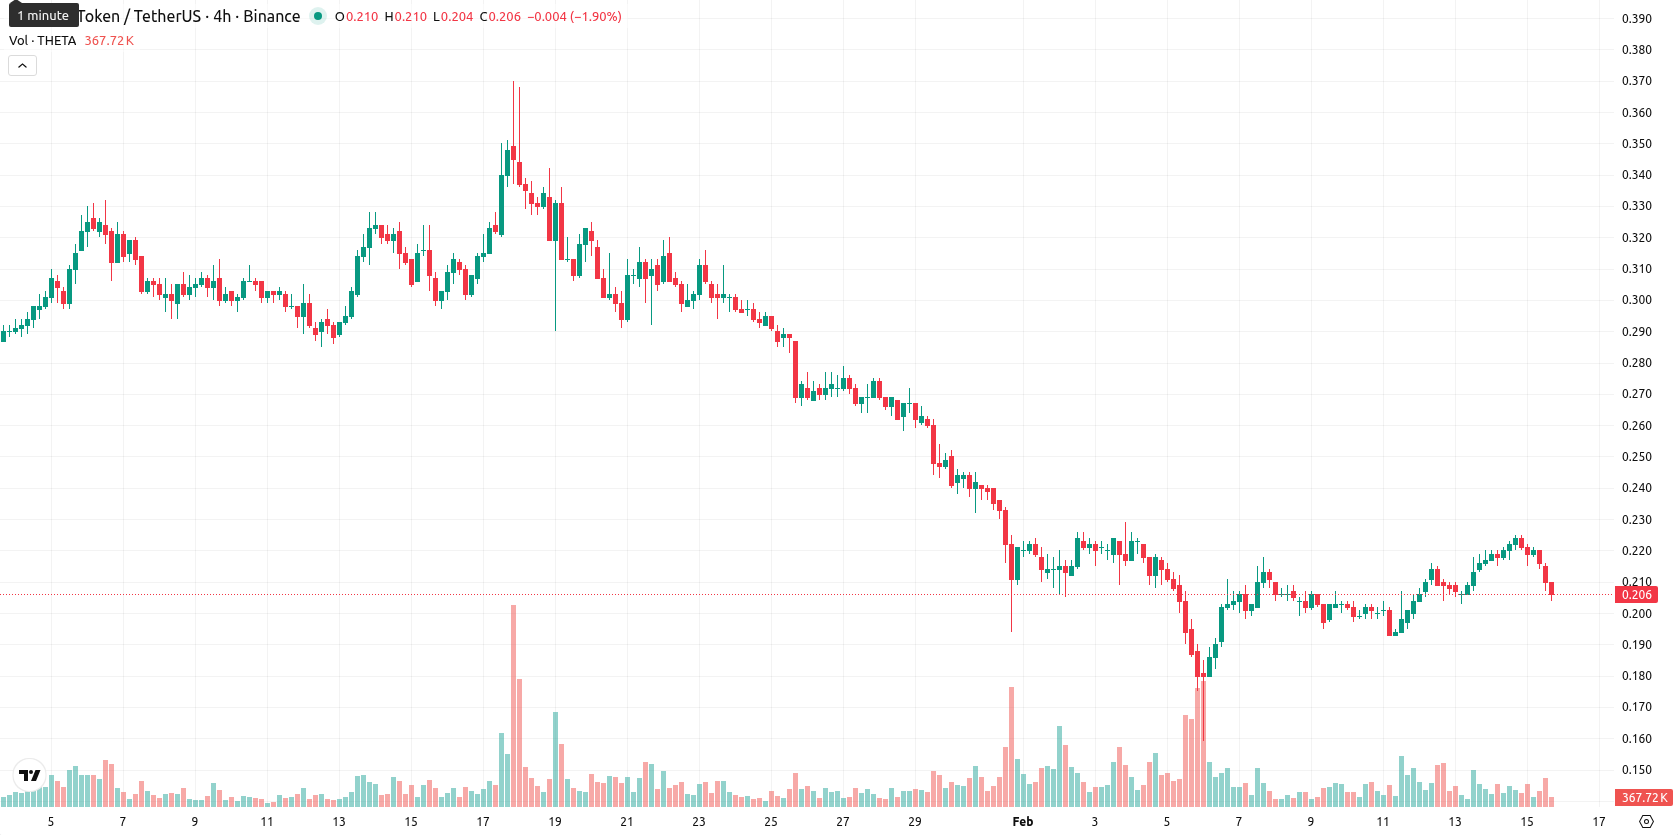
Technical breakdown below key averages — Theta slides 7.66%

Theta (THETA) is currently trading below the MA-20 ($0.222), MA-50 ($0.268), and MA-200 ($0.514), signaling ongoing bearish pressure over the short, medium, and long-term horizons. The price now sits near the session low after a steep daily decline, with recent action remaining beneath all key moving averages and failing to find immediate support from major trend lines.
Highlights
- THETA is trading below the MA-20 ($0.222), MA-50 ($0.268), and MA-200 ($0.514), confirming bearish pressure across all timeframes.
- Momentum indicators like MACD, ADX, and RSI (43.86) remain negative, while Stochastic RSI at 100 signals a potential relief amid prevailing weakness.
- Key levels to watch are resistance at $0.242 (Ichimoku Kijun) and support at $0.203, with downside favored unless a breakout above resistance occurs.
Bearish momentum confirmed amid conflicting oscillator signals
Momentum signals remain strongly bearish, with both MACD and ADX confirming negative momentum on the daily timeframe. RSI sits at 43.86 (below neutral), while the Stochastic RSI reads overbought at 100 — highlighting a divergence where price is weak but the oscillator hints at a potential relief. The Commodity Channel Index remains neutral, and Bull/Bear Power, while forecasted as "Strong Buy," is only slightly positive, suggesting a weak but present buyer response beneath persistent seller dominance. The closest dynamic resistance stands at the $0.242 Ichimoku Kijun level, while the $0.207 – $0.222 intraday range reflects high volatility and selling pressure after the open.
Downside risk prevails as volatility limits upside potential
Looking ahead, the expected range for the next five trading days is approximately $0.203 – $0.247, representing a typical volatility band relative to current levels. There is a very low probability (less than 20%) of a sustained price increase, while further downside is more likely as all weekly trend indicators point to continued weakness. The baseline scenario sees THETA stabilizing sideways between support and resistance. A bullish move requires a breakout above $0.242 toward $0.247, while a bearish scenario unfolds if the price breaks below $0.203, potentially exposing new lows in line with the prevailing downward trend.
Last time, analysts noted that Theta Network is trading below all major moving averages, reflecting sustained downward pressure on short-, medium-, and long-term trends. Daily technical indicators present a mixed outlook, with bearish momentum from MACD and ADX contrasting against oversold signals on RSI and CCI, while immediate resistance stands near $0.2710 and dynamic support is found at $0.2645 amid high intraday volatility.


Latest Theta News


-
 Afghanistan
-
 Albania
-
 Algeria
-
 Angola
-
 Argentina
-
 Armenia
-
 Australia
-
 Austria
-
 Azerbaijan
-
 Bahamas
-
 Bahrain
-
 Bangladesh
-
 Belarus
-
 Belgium
-
 Bolivia
-
 Botswana
-
 Brazil
-
 Brunei
-
 Bulgaria
-
 Cambodia
-
 Cameroon
-
 Canada
-
 Chile
Chile
-
 China
China
-
 Colombia
-
 Congo
Congo
-
 Costa Rica
-
 Cote d'Ivoire
-
 Croatia
-
 Cuba
Cuba
-
 Cyprus
-
 Czechia
-
 DR Congo
-
 Denmark
-
 Dominican Republic
-
 Ecuador
-
 Egypt
Egypt
-
 El Salvador
-
 Estonia
-
 Eswatini
-
 Ethiopia
-
 Finland
-
 France
-
 Georgia
-
 Germany
-
 Ghana
Ghana
-
 Greece
-
 Haiti
Haiti
-
 Hong Kong
-
 Hungary
-
 India
India
-
 Indonesia
-
 Iran, Islamic republic
-
 Iraq
Iraq
-
 Ireland
-
 Israel
-
 Italy
Italy
-
 Jamaica
-
 Japan
Japan
-
 Jordan
-
 Kazakhstan
-
 Kenya
Kenya
-
 Korea
Korea
-
 Kuwait
-
 Kyrgyzstan
-
 Laos
Laos
-
 Latvia
-
 Lebanon
-
 Lesotho
-
 Libya
Libya
-
 Lithuania
-
 Luxembourg
-
 Madagascar
-
 Malaysia
-
 Malta
Malta
-
 Mauritius
-
 Mexico
-
 Moldova
-
 Mongolia
-
 Montenegro
-
 Morocco
-
 Mozambique
-
 Myanmar
-
 Namibia
-
 Nepal
Nepal
-
 Netherlands
-
 New Zealand
-
 Nigeria
-
 North Macedonia
-
 Norway
-
 Oman
Oman
-
 Pakistan
-
 Palestine
-
 Panama
-
 Papua New Guinea
-
 Paraguay
-
 Peru
Peru
-
 Philippines
-
 Poland
-
 Portugal
-
 Puerto Rico
-
 Qatar
Qatar
-
 Reunion
-
 Romania
-
 Rwanda
-
 Saudi Arabia
-
 Serbia
-
 Singapore
-
 Slovakia
-
 Slovenia
-
 Somalia
-
 South Africa
-
 Spain
Spain
-
 Sri Lanka
-
 Sweden
-
 Switzerland
-
 Syria
Syria
-
 Taiwan
-
 Tajikistan
-
 Tanzania
-
 Thailand
-
 Trinidad and Tobago
-
 Tunisia
-
 Turkey
-
 UAE
UAE
-
 Uganda
-
 Ukraine
-
 United Kingdom
-
United States
-
 Uruguay
-
 Uzbekistan
-
 Venezuela
-
 Vietnam
-
 Yemen
Yemen
-
 Zambia
-
 Zimbabwe
- Forex
- Crypto
