
-8.35% for Jupiter — technical barriers persist as bearish indicators outweigh buyers

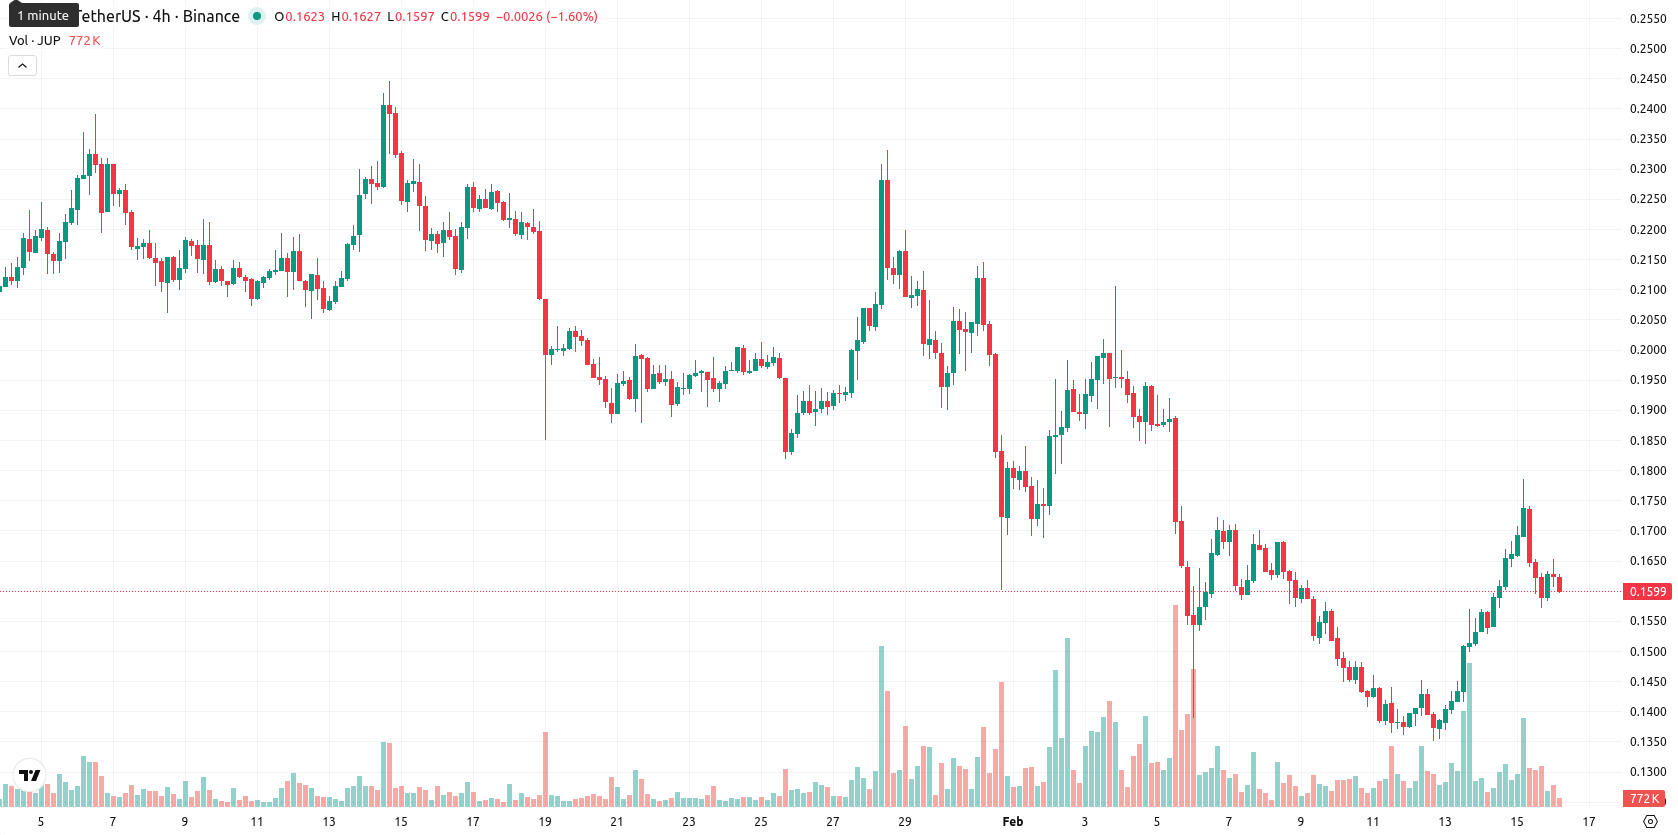
Jupiter (JUP) is trading at $0.1602, down 8.35% on the day and under persistent pressure below the MA-20 ($0.1728), MA-50 ($0.1935), and MA-200 ($0.3380), all pointing to sustained seller dominance across timeframes.
Highlights
- Jupiter (JUP), the governance token for Solana’s largest DeFi superapp, attracted hundreds of millions in new locked capital, signaling strong recent investment flows.
- Despite capital inflows, JUP on-chain activity slumped to a two-year low, raising concerns about sustainability of current demand and usage momentum.
- JUP trades at $0.1602 below its MA-20, MA-50, and MA-200, with technical indicators pointing to persistent bearish momentum and a likely drift between $0.145 and $0.175.
Mixed investment flows and low activity drive demand uncertainty
Jupiter, the governance and ecosystem token behind Solana's largest DeFi superapp, has recently seen significant capital inflows with hundreds of millions of dollars moving into locked positions. Despite these investments, on-chain activity for JUP has dropped to a two-year low, raising concerns about the durability of recent demand. Alongside its continued role powering swaps, perpetual trading, launchpads, and protocol governance, these mixed signals highlight both the strength of recent ecosystem engagement and caution regarding transaction-based momentum.
Momentum divergence as trend signals warn of persistent downside
Technical analysis shows that JUP remains below key moving averages — with MA-20 at $0.1728, MA-50 at $0.1935, and MA-200 at $0.3380 — confirming broad-based seller control. While dynamic resistance is established at the Ichimoku Kijun level ($0.1841), immediate support is undefined according to Ichimoku. On the daily chart, bearish momentum prevails: both MACD and ADX suggest a weakening trend, RSI stands at 44.66, and the Commodity Channel Index is mildly negative, all suggesting the absence of clear overbought or oversold conditions. Stochastic RSI is neutral; however, Bull/Bear Power indicates strong short-term buyer interest, creating a notable divergence where most signals warn of ongoing downside risk, yet some short-term oscillators point to potential for a rebound.
Limited upside probability amid entrenched bearish indicators
In the short term, JUP is likely to trade within a volatility band between $0.145 and $0.175, keeping the current price of $0.1602 near the middle of this range. There is a very low chance (less than 20%) of a significant upside move as the weekly momentum indicators — including RSI, ADX, MACD, and MA-50 — all point to continued bearish pressure and a greater likelihood of further declines. The baseline scenario expects choppy sideways movement. A bullish reversal would require a confirmed break and sustained close above $0.1841, while a drop below $0.145 would likely accelerate further selling.
Previously it was reported that Jupiter has regained short-term momentum by reclaiming its 20-day moving average, yet remains well below its 50- and 200-day averages, signaling that broader bearish trends persist. Momentum indicators are mixed—MACD and ADX are weak or negative, RSI is neutral, Stochastic RSI is overbought—and price is expected to remain range-bound with key resistance near $0.1943 and support around $0.174.


Latest Jupiter News


-
 Afghanistan
-
 Albania
-
 Algeria
-
 Angola
-
 Argentina
-
 Armenia
-
 Australia
-
 Austria
-
 Azerbaijan
-
 Bahamas
-
 Bahrain
-
 Bangladesh
-
 Belarus
-
 Belgium
-
 Bolivia
-
 Botswana
-
 Brazil
-
 Brunei
-
 Bulgaria
-
 Cambodia
-
 Cameroon
-
 Canada
-
 Chile
Chile
-
 China
China
-
 Colombia
-
 Congo
Congo
-
 Costa Rica
-
 Cote d'Ivoire
-
 Croatia
-
 Cuba
Cuba
-
 Cyprus
-
 Czechia
-
 DR Congo
-
 Denmark
-
 Dominican Republic
-
 Ecuador
-
 Egypt
Egypt
-
 El Salvador
-
 Estonia
-
 Eswatini
-
 Ethiopia
-
 Finland
-
 France
-
 Georgia
-
 Germany
-
 Ghana
Ghana
-
 Greece
-
 Haiti
Haiti
-
 Hong Kong
-
 Hungary
-
 India
India
-
 Indonesia
-
 Iran, Islamic republic
-
 Iraq
Iraq
-
 Ireland
-
 Israel
-
 Italy
Italy
-
 Jamaica
-
 Japan
Japan
-
 Jordan
-
 Kazakhstan
-
 Kenya
Kenya
-
 Korea
Korea
-
 Kuwait
-
 Kyrgyzstan
-
 Laos
Laos
-
 Latvia
-
 Lebanon
-
 Lesotho
-
 Libya
Libya
-
 Lithuania
-
 Luxembourg
-
 Madagascar
-
 Malaysia
-
 Malta
Malta
-
 Mauritius
-
 Mexico
-
 Moldova
-
 Mongolia
-
 Montenegro
-
 Morocco
-
 Mozambique
-
 Myanmar
-
 Namibia
-
 Nepal
Nepal
-
 Netherlands
-
 New Zealand
-
 Nigeria
-
 North Macedonia
-
 Norway
-
 Oman
Oman
-
 Pakistan
-
 Palestine
-
 Panama
-
 Papua New Guinea
-
 Paraguay
-
 Peru
Peru
-
 Philippines
-
 Poland
-
 Portugal
-
 Puerto Rico
-
 Qatar
Qatar
-
 Reunion
-
 Romania
-
 Rwanda
-
 Saudi Arabia
-
 Serbia
-
 Singapore
-
 Slovakia
-
 Slovenia
-
 Somalia
-
 South Africa
-
 Spain
Spain
-
 Sri Lanka
-
 Sweden
-
 Switzerland
-
 Syria
Syria
-
 Taiwan
-
 Tajikistan
-
 Tanzania
-
 Thailand
-
 Trinidad and Tobago
-
 Tunisia
-
 Turkey
-
 UAE
UAE
-
 Uganda
-
 Ukraine
-
 United Kingdom
-
United States
-
 Uruguay
-
 Uzbekistan
-
 Venezuela
-
 Vietnam
-
 Yemen
Yemen
-
 Zambia
-
 Zimbabwe
- Forex
- Crypto
