
Bonk: Weak buyer interest and key support risks drive new losses

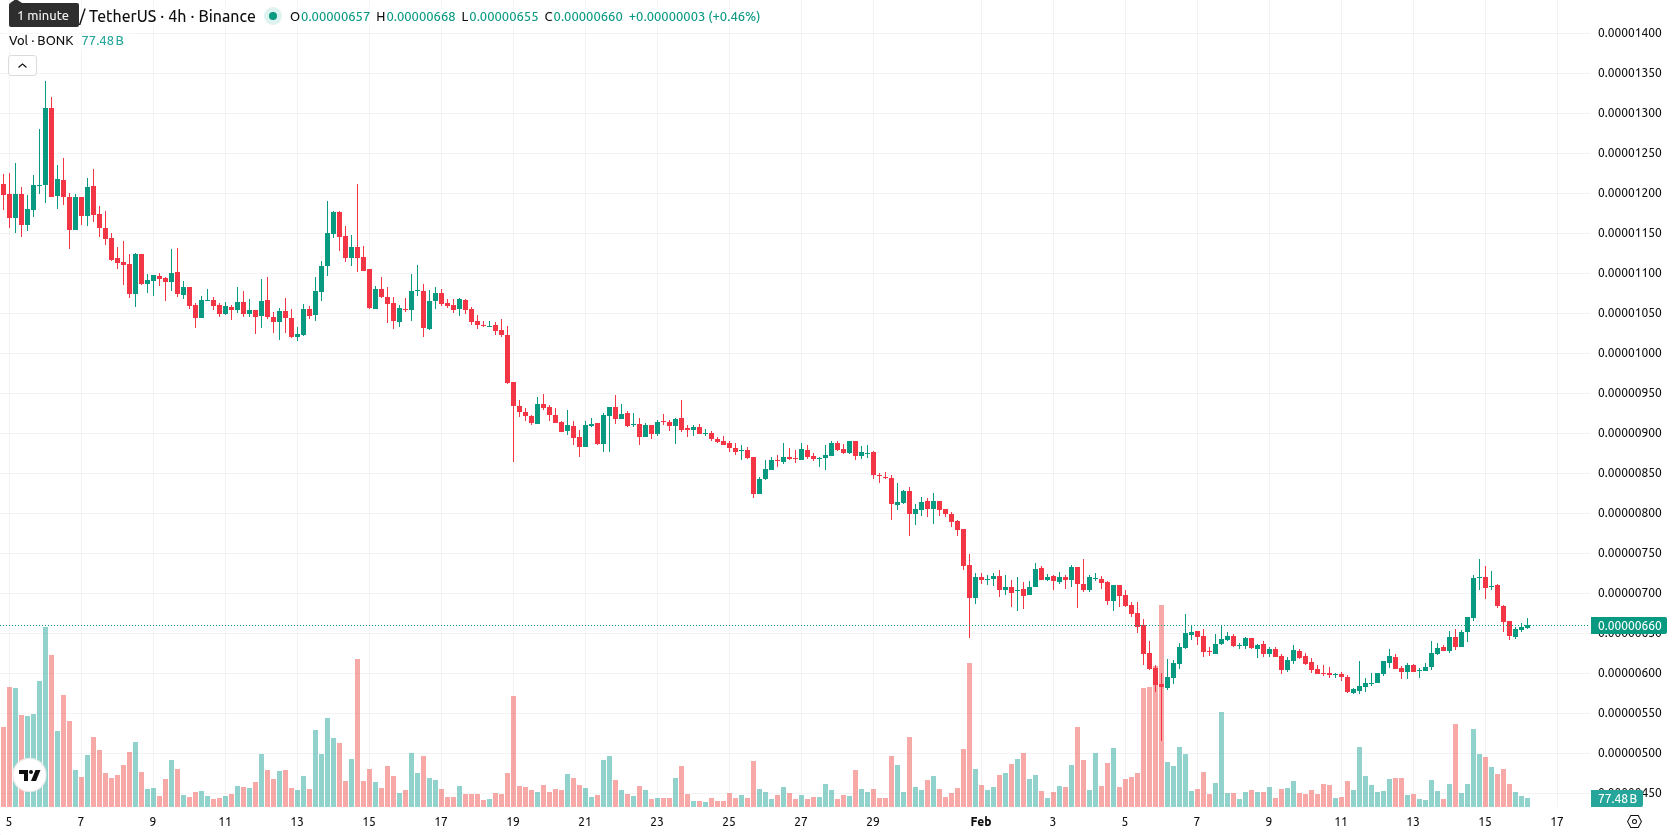
Bonk (BONK) is currently trading at $0.0000066, below the MA-20 ($0.00000693), MA-50 ($0.00000863), and MA-200 ($0.00001464), signaling consistent bearish pressure across short-, medium-, and long-term timeframes. The price has fallen 7.16% today, remaining near the low end of the daily range amid subdued trading activity, underscoring ongoing downside momentum.
Highlights
- Bonk surged 157% in trading volume, briefly breaking its prior downtrend and climbing above its descending channel before reversing course.
- After a three-day recovery, Bonk pulled back but remains just above a recent support threshold, with risk of retesting the February 5 low.
- BONK trades at $0.0000066, below the MA-20, MA-50, and MA-200, with strong bearish indicators and key support at $0.0000059; further price decline probability exceeds 80%.
Volatility spike challenges downtrend as volume surge triggers pullback risk
Bonk saw notable price volatility as trading volume surged by 157%, which temporarily disrupted its prior downtrend and pushed the token above its descending channel. Following a three-day recovery streak, the asset reversed, with a pullback that left it holding just above a recent support threshold. The potential for a retest of the February 5 low remains a risk factor in the backdrop.
Bearish technical setup persists as sellers dominate below resistance
The current price sits below all major moving averages, with resistance marked at the Ichimoku Kijun level of $0.00000731 and support near recent lows, confirming continued downward momentum. Technical indicators reinforce the bearish outlook: MACD and ADX show selling pressure, while the RSI at 41 and Stochastic RSI indicate a tilt toward oversold conditions, though not at extreme levels. Bull/Bear Power hints at minor buyer presence, but sellers remain dominant, and the Awesome Oscillator is neutral, failing to confirm any reversal. Intraday signals show brief buying attempts, yet overall, the daily technical setup suggests persistent weakness.
Further losses likely as volatility band limits reversal potential
Over the next five trading days, BONK is likely to trade within a typical volatility band between $0.0000059 and $0.0000071. There is a high probability (over 80%) of further downside, with a sideways scenario as the baseline outcome. A bullish reversal would require a break above the Ichimoku Kijun at $0.00000731, opening the door for a move toward the upper range. On the downside, a break below recent support could bring a test of $0.0000059.
Previously it was reported that Bonk demonstrated short-term strength by trading just above the 20-day moving average but remains below the 50-day and 200-day moving averages, indicating an overall bearish long-term trend. Technical indicators reflect prevailing bearish momentum, with dynamic support at the Kijun line and robust resistance at the MA-50, while oscillators signal potential overextension and limited upside amid consolidation and downside risks in the near term.


-
 Afghanistan
-
 Albania
-
 Algeria
-
 Angola
-
 Argentina
-
 Armenia
-
 Australia
-
 Austria
-
 Azerbaijan
-
 Bahamas
-
 Bahrain
-
 Bangladesh
-
 Belarus
-
 Belgium
-
 Bolivia
-
 Botswana
-
 Brazil
-
 Brunei
-
 Bulgaria
-
 Cambodia
-
 Cameroon
-
 Canada
-
 Chile
Chile
-
 China
China
-
 Colombia
-
 Congo
Congo
-
 Costa Rica
-
 Cote d'Ivoire
-
 Croatia
-
 Cuba
Cuba
-
 Cyprus
-
 Czechia
-
 DR Congo
-
 Denmark
-
 Dominican Republic
-
 Ecuador
-
 Egypt
Egypt
-
 El Salvador
-
 Estonia
-
 Eswatini
-
 Ethiopia
-
 Finland
-
 France
-
 Georgia
-
 Germany
-
 Ghana
Ghana
-
 Greece
-
 Haiti
Haiti
-
 Hong Kong
-
 Hungary
-
 India
India
-
 Indonesia
-
 Iran, Islamic republic
-
 Iraq
Iraq
-
 Ireland
-
 Israel
-
 Italy
Italy
-
 Jamaica
-
 Japan
Japan
-
 Jordan
-
 Kazakhstan
-
 Kenya
Kenya
-
 Korea
Korea
-
 Kuwait
-
 Kyrgyzstan
-
 Laos
Laos
-
 Latvia
-
 Lebanon
-
 Lesotho
-
 Libya
Libya
-
 Lithuania
-
 Luxembourg
-
 Madagascar
-
 Malaysia
-
 Malta
Malta
-
 Mauritius
-
 Mexico
-
 Moldova
-
 Mongolia
-
 Montenegro
-
 Morocco
-
 Mozambique
-
 Myanmar
-
 Namibia
-
 Nepal
Nepal
-
 Netherlands
-
 New Zealand
-
 Nigeria
-
 North Macedonia
-
 Norway
-
 Oman
Oman
-
 Pakistan
-
 Palestine
-
 Panama
-
 Papua New Guinea
-
 Paraguay
-
 Peru
Peru
-
 Philippines
-
 Poland
-
 Portugal
-
 Puerto Rico
-
 Qatar
Qatar
-
 Reunion
-
 Romania
-
 Rwanda
-
 Saudi Arabia
-
 Serbia
-
 Singapore
-
 Slovakia
-
 Slovenia
-
 Somalia
-
 South Africa
-
 Spain
Spain
-
 Sri Lanka
-
 Sweden
-
 Switzerland
-
 Syria
Syria
-
 Taiwan
-
 Tajikistan
-
 Tanzania
-
 Thailand
-
 Trinidad and Tobago
-
 Tunisia
-
 Turkey
-
 UAE
UAE
-
 Uganda
-
 Ukraine
-
 United Kingdom
-
United States
-
 Uruguay
-
 Uzbekistan
-
 Venezuela
-
 Vietnam
-
 Yemen
Yemen
-
 Zambia
-
 Zimbabwe
- Forex
- Crypto
