
Technical weakness and sell signals persist — Jupiter slips 7.03%

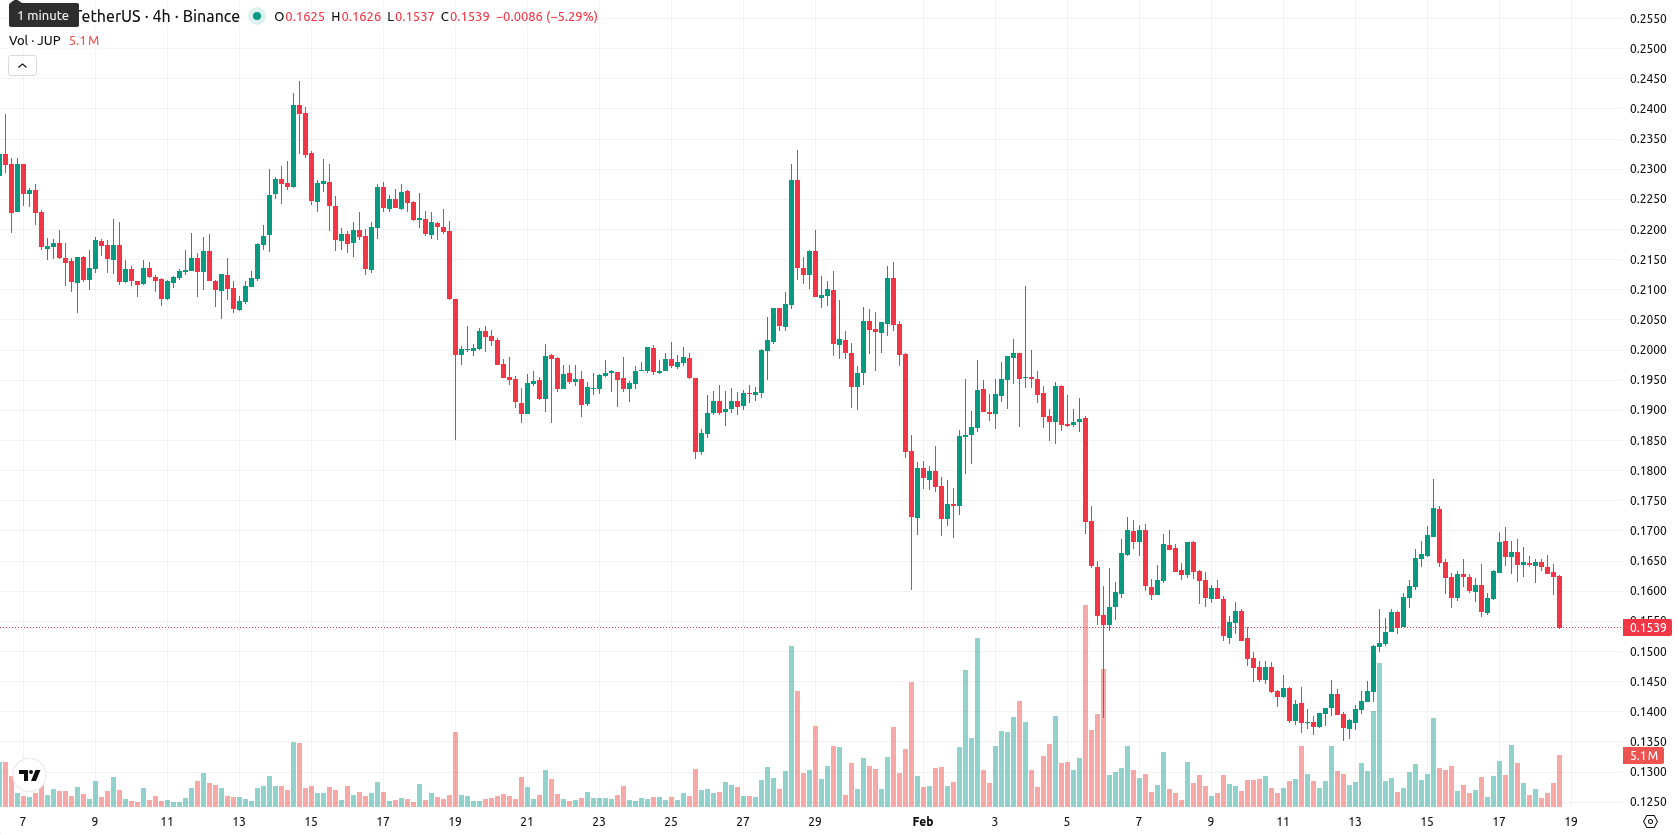
Jupiter (JUP) is trading at $0.1547 after slipping 7.03% on the day, sitting firmly below the MA-20 ($0.1681), MA-50 ($0.1923), and MA-200 ($0.3350), which underscores ongoing seller dominance across all monitored timeframes. The nearest dynamic resistance is noted at the Ichimoku Kijun level of $0.1841, with no significant moving average crossovers at present.
Highlights
- Jupiter launched native staking as collateral for borrowing against staked SOL, expanded to six validators, boosting protocol TVL above $2 billion.
- The 'Going Green' governance proposal aims for net-zero $JUP emissions by 2026, following a 3 billion $JUP burn and $70 million buyback allocation.
- JUP trades at $0.1547, below key moving averages, with resistance at $0.1841 and a bearish short-term outlook (20% probability of price increase next week).
Protocol upgrades and governance shift drive higher user engagement
Jupiter has introduced native staking as collateral, enabling users to borrow against natively staked SOL in specific vaults and expanding this feature to six validators. The protocol's Total Value Locked (TVL) has surpassed $2 billion, reflecting elevated user participation. Additionally, Jupiter recently announced the 'Going Green' governance proposal that targets net-zero $JUP emissions by 2026, after conducting a 3 billion $JUP token burn and allocating $70 million for buybacks, with the current governance vote expected to influence token supply and platform incentives.
Broad bearish momentum as technicals align with selling pressure
JUP remains technically weak, trading below all key moving averages, with daily momentum signals pointing to persistent bearishness. MACD gives a strong sell signal and the ADX suggests the absence of a clear trend, while the RSI also shows downside bias. Oscillator readings are mixed, with an overbought Stochastic RSI, neutral Commodity Channel Index, and a neutral Awesome Oscillator; Bull/Bear Power highlights short-term selling pressure. The current price hovers near the session low within a volatile daily range of $0.1558 to $0.1660.
Consolidation outlook amid low odds for near-term rebound
In the short term, JUP is expected to consolidate within a volatility band of $0.1390 to $0.1690, with a less than 20% chance of a price rebound. The base scenario points to continued sideway movement unless buyers lift the price above the $0.1841 Kijun resistance, which could indicate a bullish reversal. Conversely, a sustained break beneath $0.1390 would increase the risk of a deeper decline.
Last time, analysts noted that Jupiter is trading below its key moving averages, with persistent bearish momentum signals (MACD, ADX, RSI) and undefined immediate support, underscoring sustained seller dominance and low likelihood of a significant upside move. Despite some short-term buying interest, overall technical indicators point to continued downside risk and range-bound trading unless a clear breakout above resistance is achieved.


Latest Jupiter News


-
 Afghanistan
-
 Albania
-
 Algeria
-
 Angola
-
 Argentina
-
 Armenia
-
 Australia
-
 Austria
-
 Azerbaijan
-
 Bahamas
-
 Bahrain
-
 Bangladesh
-
 Belarus
-
 Belgium
-
 Bolivia
-
 Botswana
-
 Brazil
-
 Brunei
-
 Bulgaria
-
 Cambodia
-
 Cameroon
-
 Canada
-
 Chile
Chile
-
 China
China
-
 Colombia
-
 Congo
Congo
-
 Costa Rica
-
 Cote d'Ivoire
-
 Croatia
-
 Cuba
Cuba
-
 Cyprus
-
 Czechia
-
 DR Congo
-
 Denmark
-
 Dominican Republic
-
 Ecuador
-
 Egypt
Egypt
-
 El Salvador
-
 Estonia
-
 Eswatini
-
 Ethiopia
-
 Finland
-
 France
-
 Georgia
-
 Germany
-
 Ghana
Ghana
-
 Greece
-
 Haiti
Haiti
-
 Hong Kong
-
 Hungary
-
 India
India
-
 Indonesia
-
 Iran, Islamic republic
-
 Iraq
Iraq
-
 Ireland
-
 Israel
-
 Italy
Italy
-
 Jamaica
-
 Japan
Japan
-
 Jordan
-
 Kazakhstan
-
 Kenya
Kenya
-
 Korea
Korea
-
 Kuwait
-
 Kyrgyzstan
-
 Laos
Laos
-
 Latvia
-
 Lebanon
-
 Lesotho
-
 Libya
Libya
-
 Lithuania
-
 Luxembourg
-
 Madagascar
-
 Malaysia
-
 Malta
Malta
-
 Mauritius
-
 Mexico
-
 Moldova
-
 Mongolia
-
 Montenegro
-
 Morocco
-
 Mozambique
-
 Myanmar
-
 Namibia
-
 Nepal
Nepal
-
 Netherlands
-
 New Zealand
-
 Nigeria
-
 North Macedonia
-
 Norway
-
 Oman
Oman
-
 Pakistan
-
 Palestine
-
 Panama
-
 Papua New Guinea
-
 Paraguay
-
 Peru
Peru
-
 Philippines
-
 Poland
-
 Portugal
-
 Puerto Rico
-
 Qatar
Qatar
-
 Reunion
-
 Romania
-
 Rwanda
-
 Saudi Arabia
-
 Serbia
-
 Singapore
-
 Slovakia
-
 Slovenia
-
 Somalia
-
 South Africa
-
 Spain
Spain
-
 Sri Lanka
-
 Sweden
-
 Switzerland
-
 Syria
Syria
-
 Taiwan
-
 Tajikistan
-
 Tanzania
-
 Thailand
-
 Trinidad and Tobago
-
 Tunisia
-
 Turkey
-
 UAE
UAE
-
 Uganda
-
 Ukraine
-
 United Kingdom
-
United States
-
 Uruguay
-
 Uzbekistan
-
 Venezuela
-
 Vietnam
-
 Yemen
Yemen
-
 Zambia
-
 Zimbabwe
- Forex
- Crypto
