
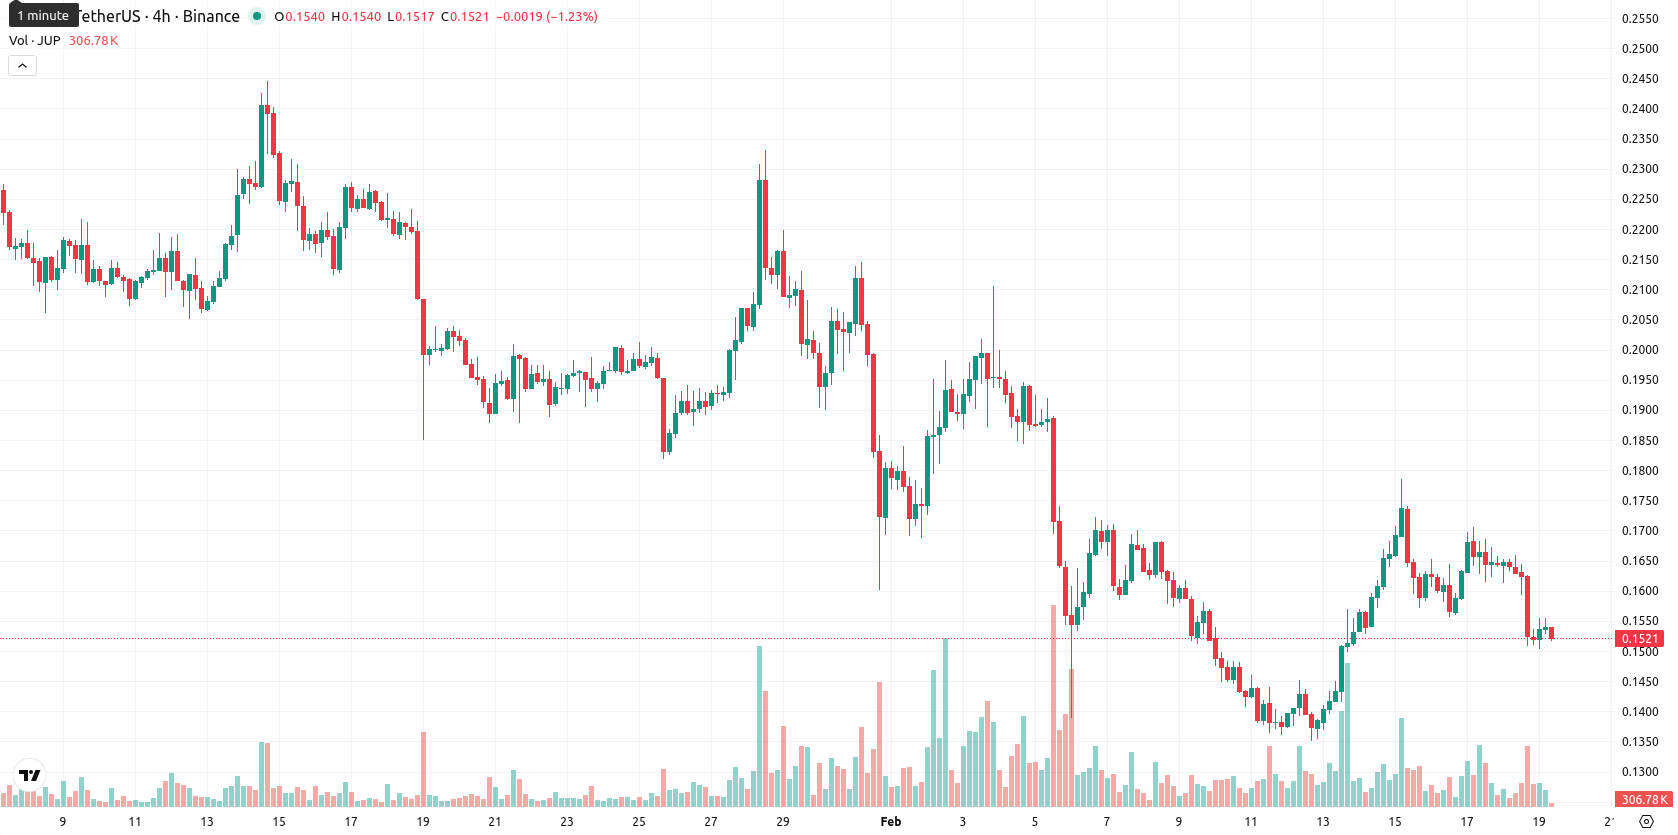
Jupiter: Persistent downtrend sees volatility and selling drive a 7.53% decline

Jupiter (JUP) is trading at $0.1523, reflecting a daily decline of 7.53% and positioning the asset below the MA-20 ($0.1657), MA-50 ($0.1915), and MA-200 ($0.3336). This consistent placement beneath key moving averages highlights ongoing bearish momentum across short-, medium-, and long-term technical frameworks.
Highlights
- JUP is trading at $0.1523, below its MA-20 ($0.1657), MA-50 ($0.1915), and MA-200 ($0.3336), confirming strong bearish pressure across all timeframes.
- Momentum readings are weak, as MACD, ADX, and RSI (40.78) indicate a lack of buying power and dominance of sell signals, with oversold conditions prevalent.
- Price is expected to consolidate between $0.137 and $0.167 over the next five days, with a bearish bias and sub-$0.150 breakdowns likely absent a reversal above $0.167.
Sell-side dominance confirmed as momentum fades below resistance
JUP faces persistent downward pressure, with the nearest dynamic resistance at the Ichimoku Kijun ($0.1841) and immediate support established near today’s low. Technical indicators underscore weak momentum: the MACD and ADX on the daily chart point to a pronounced lack of buying power and trend strength, while the RSI at 40.78, Stochastic RSI oversold levels, and CCI below -50 highlight prevailing sell conditions. Bull/Bear Power is marginally positive but inconclusive, indicating that sellers remain dominant over recent swings. The Awesome Oscillator signals neutrality within the downtrend, and price action continues to track the lower end of today’s volatile range ($0.1504 – $0.1555), reinforcing overall bearish control across all major indicators.
Further declines likely as technicals favor downside continuation
In the short term, JUP is projected to move within a $0.137 to $0.167 volatility band relative to current levels. Technicals point to a less than 20% chance of a rebound and a much higher likelihood of continued declines, supported by consistent “sell” and “strong sell” signals on weekly Moving Average, RSI, ADX, and MACD. The baseline scenario anticipates sideways consolidation within this corridor if no new bearish drivers take shape. A trend reversal would require a decisive breakout above the Ichimoku Kijun and $0.167, which remains unlikely absent a surge in buying power; a bearish case sees JUP slipping beneath $0.150 support toward the lower end of the expected range.
Last time, analysts noted that Jupiter continued to trade below all key moving averages with strong bearish momentum, as technical signals including MACD, RSI, and ADX reinforced prevailing selling pressure. The asset faces dynamic resistance at the Ichimoku Kijun level, and without buyer interest pushing above this threshold, consolidation within a lower volatility band is expected amid limited rebound potential.


Latest Jupiter News


-
 Afghanistan
-
 Albania
-
 Algeria
-
 Angola
-
 Argentina
-
 Armenia
-
 Australia
-
 Austria
-
 Azerbaijan
-
 Bahamas
-
 Bahrain
-
 Bangladesh
-
 Belarus
-
 Belgium
-
 Bolivia
-
 Botswana
-
 Brazil
-
 Brunei
-
 Bulgaria
-
 Cambodia
-
 Cameroon
-
 Canada
-
 Chile
Chile
-
 China
China
-
 Colombia
-
 Congo
Congo
-
 Costa Rica
-
 Cote d'Ivoire
-
 Croatia
-
 Cuba
Cuba
-
 Cyprus
-
 Czechia
-
 DR Congo
-
 Denmark
-
 Dominican Republic
-
 Ecuador
-
 Egypt
Egypt
-
 El Salvador
-
 Estonia
-
 Eswatini
-
 Ethiopia
-
 Finland
-
 France
-
 Georgia
-
 Germany
-
 Ghana
Ghana
-
 Greece
-
 Haiti
Haiti
-
 Hong Kong
-
 Hungary
-
 India
India
-
 Indonesia
-
 Iran, Islamic republic
-
 Iraq
Iraq
-
 Ireland
-
 Israel
-
 Italy
Italy
-
 Jamaica
-
 Japan
Japan
-
 Jordan
-
 Kazakhstan
-
 Kenya
Kenya
-
 Korea
Korea
-
 Kuwait
-
 Kyrgyzstan
-
 Laos
Laos
-
 Latvia
-
 Lebanon
-
 Lesotho
-
 Libya
Libya
-
 Lithuania
-
 Luxembourg
-
 Madagascar
-
 Malaysia
-
 Malta
Malta
-
 Mauritius
-
 Mexico
-
 Moldova
-
 Mongolia
-
 Montenegro
-
 Morocco
-
 Mozambique
-
 Myanmar
-
 Namibia
-
 Nepal
Nepal
-
 Netherlands
-
 New Zealand
-
 Nigeria
-
 North Macedonia
-
 Norway
-
 Oman
Oman
-
 Pakistan
-
 Palestine
-
 Panama
-
 Papua New Guinea
-
 Paraguay
-
 Peru
Peru
-
 Philippines
-
 Poland
-
 Portugal
-
 Puerto Rico
-
 Qatar
Qatar
-
 Reunion
-
 Romania
-
 Rwanda
-
 Saudi Arabia
-
 Serbia
-
 Singapore
-
 Slovakia
-
 Slovenia
-
 Somalia
-
 South Africa
-
 Spain
Spain
-
 Sri Lanka
-
 Sweden
-
 Switzerland
-
 Syria
Syria
-
 Taiwan
-
 Tajikistan
-
 Tanzania
-
 Thailand
-
 Trinidad and Tobago
-
 Tunisia
-
 Turkey
-
 UAE
UAE
-
 Uganda
-
 Ukraine
-
 United Kingdom
-
United States
-
 Uruguay
-
 Uzbekistan
-
 Venezuela
-
 Vietnam
-
 Yemen
Yemen
-
 Zambia
-
 Zimbabwe
- Forex
- Crypto
