
Fetch.ai: Bearish trend and volatility drive a sharp decline

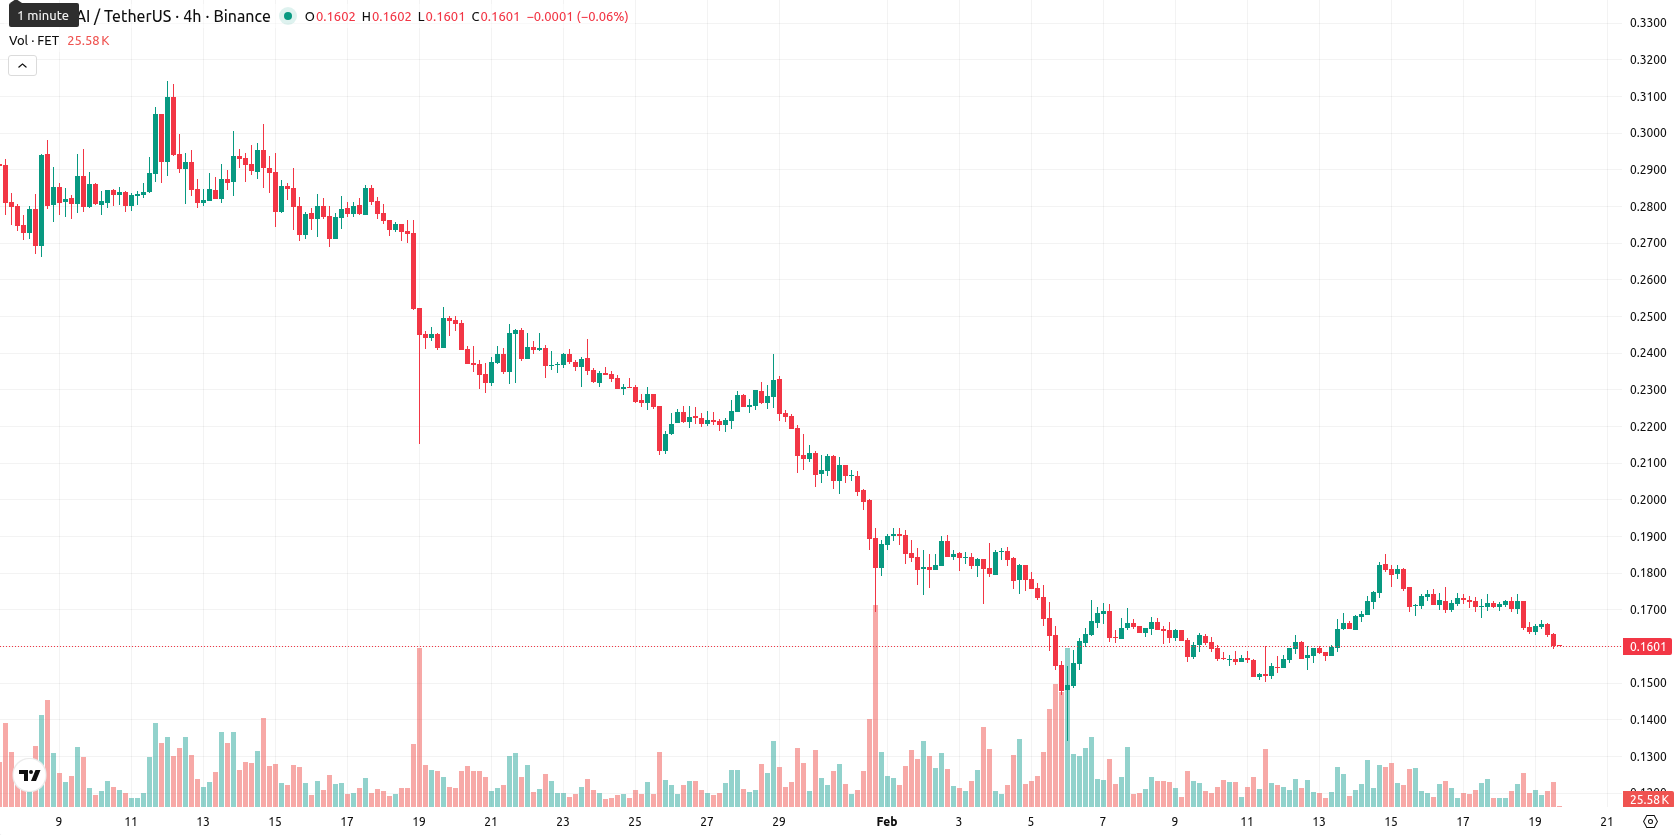
Fetch.ai (FET) is trading at $0.1601, marking a daily decline of $0.0125 or 7.24%. The asset remains under significant selling pressure, standing well below its MA-20 at $0.1712, MA-50 at $0.2212, and MA-200 at $0.3795.
Highlights
- FET is trading at $0.1601, below its MA-20 ($0.1712), MA-50 ($0.2212), and MA-200 ($0.3795), reflecting sustained selling pressure across all timeframes.
- Momentum indicators—including daily and weekly MACD, RSI (38.34 D1; 33.07 W1), and ADX—signal a persistent bearish trend, with sellers dominating price action.
- The next resistance is at $0.1869 (Ichimoku Kijun), while a break below $0.150 would expose further downside, with probabilistic range expected between $0.145 and $0.175 in the next five days.
Bearish signals reinforced as resistance holds and momentum weakens
Technical indicators confirm the bearish sentiment for FET. The Ichimoku Kijun at $0.1869 serves as the nearest dynamic resistance, while no notable support stands above the current price — reinforcing the negative trend. Momentum remains weak, with strong sell signals from the MACD on both daily and weekly charts, and a persistent downtrend indicated by the ADX (D1). RSI readings of 38.34 (D1) and 33.07 (W1) point to bearish momentum without reaching oversold territory. The Commodity Channel Index is neutral but highlights increasing downside risk on short timeframes. Bull/Bear Power is slightly positive on D1 but mostly negative intraday, and the Awesome Oscillator remains neutral. Intraday volatility remains high, with FET trading near its session low of $0.1591 after a mild gap down at the open.
Sideways or lower move expected as rebound odds diminish
Over the next five trading days, FET is expected to move within a volatility band of $0.145–$0.175, relative to current levels and recent price action. The likelihood of a price rebound is low (less than 20%), with downward movement more probable. In the base case, FET may drift sideways inside this channel, with no clear bullish momentum. A break above $0.1869 (Ichimoku Kijun) could spark short covering, while a move below $0.150 would confirm a deepening bearish trend.
Previously it was reported that Fetch.ai is trading just below its short-term MA-20 and well under the MA-50 and MA-200, indicating continued selling pressure across all timeframes. Despite intraday gains and mixed momentum signals, weak MACD and trending-down RSI suggest limited upside, with the price likely to remain range-bound between support at $0.174 and resistance at $0.189.


Latest FET News


-
 Afghanistan
-
 Albania
-
 Algeria
-
 Angola
-
 Argentina
-
 Armenia
-
 Australia
-
 Austria
-
 Azerbaijan
-
 Bahamas
-
 Bahrain
-
 Bangladesh
-
 Belarus
-
 Belgium
-
 Bolivia
-
 Botswana
-
 Brazil
-
 Brunei
-
 Bulgaria
-
 Cambodia
-
 Cameroon
-
 Canada
-
 Chile
Chile
-
 China
China
-
 Colombia
-
 Congo
Congo
-
 Costa Rica
-
 Cote d'Ivoire
-
 Croatia
-
 Cuba
Cuba
-
 Cyprus
-
 Czechia
-
 DR Congo
-
 Denmark
-
 Dominican Republic
-
 Ecuador
-
 Egypt
Egypt
-
 El Salvador
-
 Estonia
-
 Eswatini
-
 Ethiopia
-
 Finland
-
 France
-
 Georgia
-
 Germany
-
 Ghana
Ghana
-
 Greece
-
 Haiti
Haiti
-
 Hong Kong
-
 Hungary
-
 India
India
-
 Indonesia
-
 Iran, Islamic republic
-
 Iraq
Iraq
-
 Ireland
-
 Israel
-
 Italy
Italy
-
 Jamaica
-
 Japan
Japan
-
 Jordan
-
 Kazakhstan
-
 Kenya
Kenya
-
 Korea
Korea
-
 Kuwait
-
 Kyrgyzstan
-
 Laos
Laos
-
 Latvia
-
 Lebanon
-
 Lesotho
-
 Libya
Libya
-
 Lithuania
-
 Luxembourg
-
 Madagascar
-
 Malaysia
-
 Malta
Malta
-
 Mauritius
-
 Mexico
-
 Moldova
-
 Mongolia
-
 Montenegro
-
 Morocco
-
 Mozambique
-
 Myanmar
-
 Namibia
-
 Nepal
Nepal
-
 Netherlands
-
 New Zealand
-
 Nigeria
-
 North Macedonia
-
 Norway
-
 Oman
Oman
-
 Pakistan
-
 Palestine
-
 Panama
-
 Papua New Guinea
-
 Paraguay
-
 Peru
Peru
-
 Philippines
-
 Poland
-
 Portugal
-
 Puerto Rico
-
 Qatar
Qatar
-
 Reunion
-
 Romania
-
 Rwanda
-
 Saudi Arabia
-
 Serbia
-
 Singapore
-
 Slovakia
-
 Slovenia
-
 Somalia
-
 South Africa
-
 Spain
Spain
-
 Sri Lanka
-
 Sweden
-
 Switzerland
-
 Syria
Syria
-
 Taiwan
-
 Tajikistan
-
 Tanzania
-
 Thailand
-
 Trinidad and Tobago
-
 Tunisia
-
 Turkey
-
 UAE
UAE
-
 Uganda
-
 Ukraine
-
 United Kingdom
-
United States
-
 Uruguay
-
 Uzbekistan
-
 Venezuela
-
 Vietnam
-
 Yemen
Yemen
-
 Zambia
-
 Zimbabwe
- Forex
- Crypto
