
+8.22% for Jupiter — oversold signals clash with volatile bounce

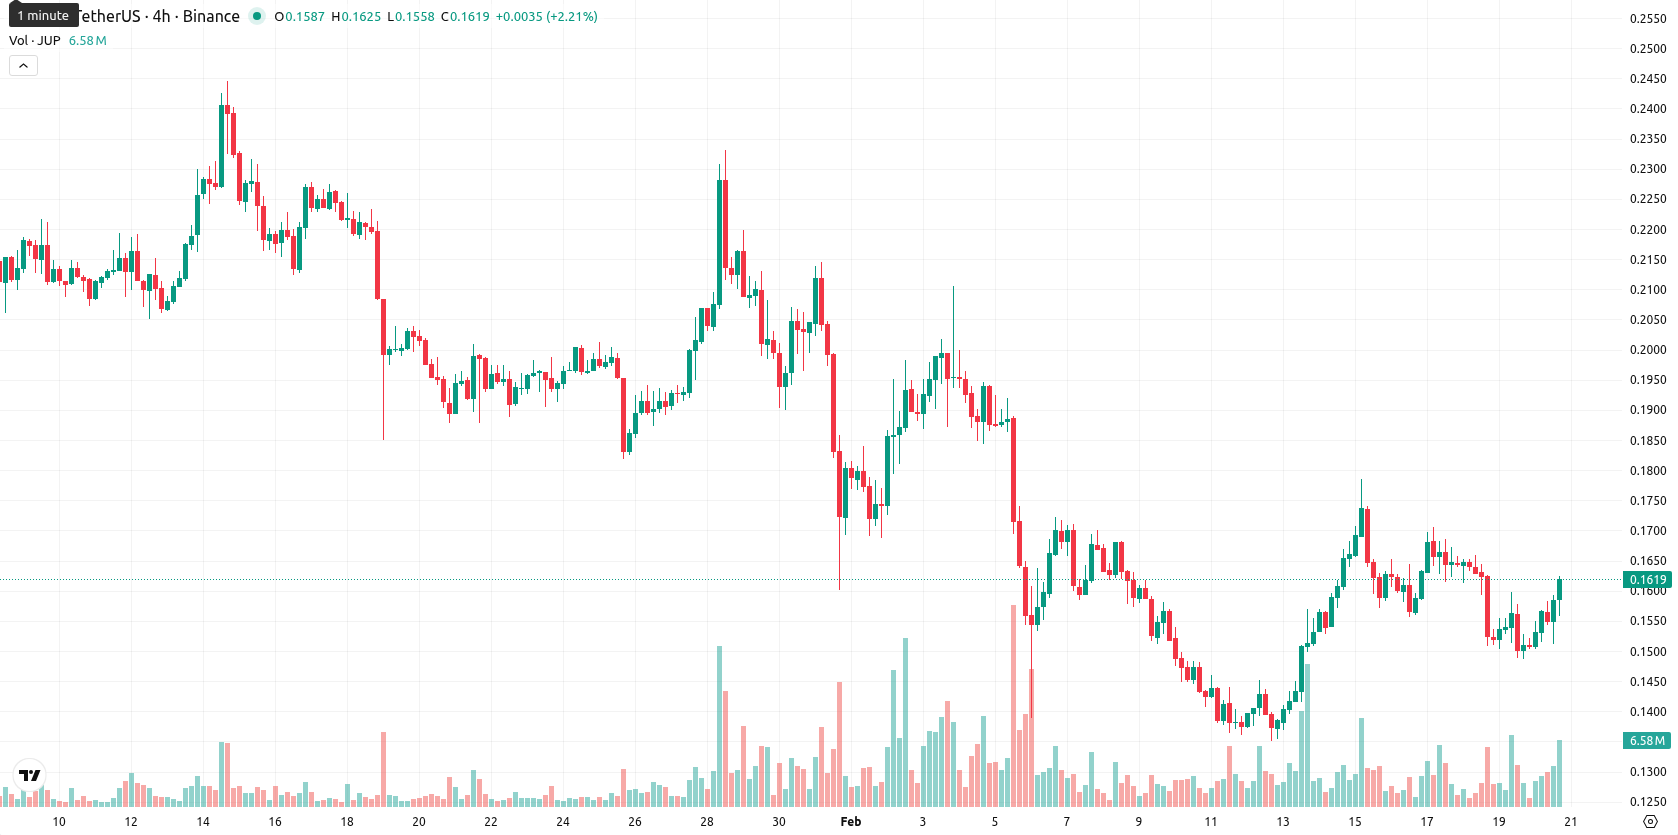
Jupiter (JUP) trades at $0.162, sitting fractionally below the MA-20 ($0.1630) and well under both the MA-50 ($0.1907) and MA-200 ($0.3320), indicating persistent selling pressure across short-, medium-, and long-term trends. The Ichimoku Kijun level stands at $0.1841, acting as immediate resistance to upward movement.
Highlights
- JUP trades at $0.162, below its MA-20 ($0.1630), MA-50 ($0.1907), and MA-200 ($0.3320), signaling ongoing bearish pressure across all timeframes.
- Momentum indicators such as daily MACD, ADX, and RSI (at 40.4) remain negative, with oversold conditions emerging but not yet extreme.
- Immediate resistance stands at $0.1841 (Ichimoku Kijun), with downside risk toward $0.150 support and a 5-day range expected between $0.146 and $0.178.
Volatile intraday rally amid oversold signals and momentum divergence
Momentum on the daily timeframe remains negative, as both the MACD and ADX signal a lack of upside strength. The RSI sits at 40.4 and the Commodity Channel Index is at -60.8, suggesting the market is leaning toward oversold but not extreme conditions, while the Stochastic RSI is neutral. Bull/Bear Power is marginally positive, hinting at some intraday buyer interest, and the Awesome Oscillator is neutral, offering no confirmation for the current recovery. After opening with almost no gap from the prior close, the price rallied 8.22% intraday and is now sitting near today's high, showing high volatility and strong momentum after the open, with some divergence visible between oversold oscillators and the price advance.
Downside risk prevails as tight range and bearish signals persist
Over the next five trading days, JUP is likely to fluctuate within a typical volatility band of $0.146 to $0.178 relative to current levels. The probability of a price increase is low (less than 20%), and further downside remains the dominant scenario, backed by consistent bearish signals from the weekly Moving Average, RSI, ADX, and MACD. The base expectation is continued sideways movement inside this range, with a bullish reversal requiring a confirmed break above the immediate resistance at $0.1841. Renewed declines could accelerate if the price falls below the $0.150 support region.
Last time, analysts noted that Jupiter is trading well below key moving averages, indicating sustained bearish momentum across short-, medium-, and long-term timeframes, with technical indicators such as MACD, ADX, RSI, and CCI all signaling prevailing sell-side dominance and weak trend strength. Immediate resistance sits at the Ichimoku Kijun, while the asset is likely to consolidate within a lower volatility range unless a decisive breakout above key resistance levels materializes, with downside continuation favored amid limited rebound potential.


Latest Jupiter News


-
 Afghanistan
-
 Albania
-
 Algeria
-
 Angola
-
 Argentina
-
 Armenia
-
 Australia
-
 Austria
-
 Azerbaijan
-
 Bahamas
-
 Bahrain
-
 Bangladesh
-
 Belarus
-
 Belgium
-
 Bolivia
-
 Botswana
-
 Brazil
-
 Brunei
-
 Bulgaria
-
 Cambodia
-
 Cameroon
-
 Canada
-
 Chile
Chile
-
 China
China
-
 Colombia
-
 Congo
Congo
-
 Costa Rica
-
 Cote d'Ivoire
-
 Croatia
-
 Cuba
Cuba
-
 Cyprus
-
 Czechia
-
 DR Congo
-
 Denmark
-
 Dominican Republic
-
 Ecuador
-
 Egypt
Egypt
-
 El Salvador
-
 Estonia
-
 Eswatini
-
 Ethiopia
-
 Finland
-
 France
-
 Georgia
-
 Germany
-
 Ghana
Ghana
-
 Greece
-
 Haiti
Haiti
-
 Hong Kong
-
 Hungary
-
 India
India
-
 Indonesia
-
 Iran, Islamic republic
-
 Iraq
Iraq
-
 Ireland
-
 Israel
-
 Italy
Italy
-
 Jamaica
-
 Japan
Japan
-
 Jordan
-
 Kazakhstan
-
 Kenya
Kenya
-
 Korea
Korea
-
 Kuwait
-
 Kyrgyzstan
-
 Laos
Laos
-
 Latvia
-
 Lebanon
-
 Lesotho
-
 Libya
Libya
-
 Lithuania
-
 Luxembourg
-
 Madagascar
-
 Malaysia
-
 Malta
Malta
-
 Mauritius
-
 Mexico
-
 Moldova
-
 Mongolia
-
 Montenegro
-
 Morocco
-
 Mozambique
-
 Myanmar
-
 Namibia
-
 Nepal
Nepal
-
 Netherlands
-
 New Zealand
-
 Nigeria
-
 North Macedonia
-
 Norway
-
 Oman
Oman
-
 Pakistan
-
 Palestine
-
 Panama
-
 Papua New Guinea
-
 Paraguay
-
 Peru
Peru
-
 Philippines
-
 Poland
-
 Portugal
-
 Puerto Rico
-
 Qatar
Qatar
-
 Reunion
-
 Romania
-
 Rwanda
-
 Saudi Arabia
-
 Serbia
-
 Singapore
-
 Slovakia
-
 Slovenia
-
 Somalia
-
 South Africa
-
 Spain
Spain
-
 Sri Lanka
-
 Sweden
-
 Switzerland
-
 Syria
Syria
-
 Taiwan
-
 Tajikistan
-
 Tanzania
-
 Thailand
-
 Trinidad and Tobago
-
 Tunisia
-
 Turkey
-
 UAE
UAE
-
 Uganda
-
 Ukraine
-
 United Kingdom
-
United States
-
 Uruguay
-
 Uzbekistan
-
 Venezuela
-
 Vietnam
-
 Yemen
Yemen
-
 Zambia
-
 Zimbabwe
- Forex
- Crypto
