
Shiba Inu slips below $0.00000634 MA-20 with weak RSI confirming bearish momentum – weekly forecast

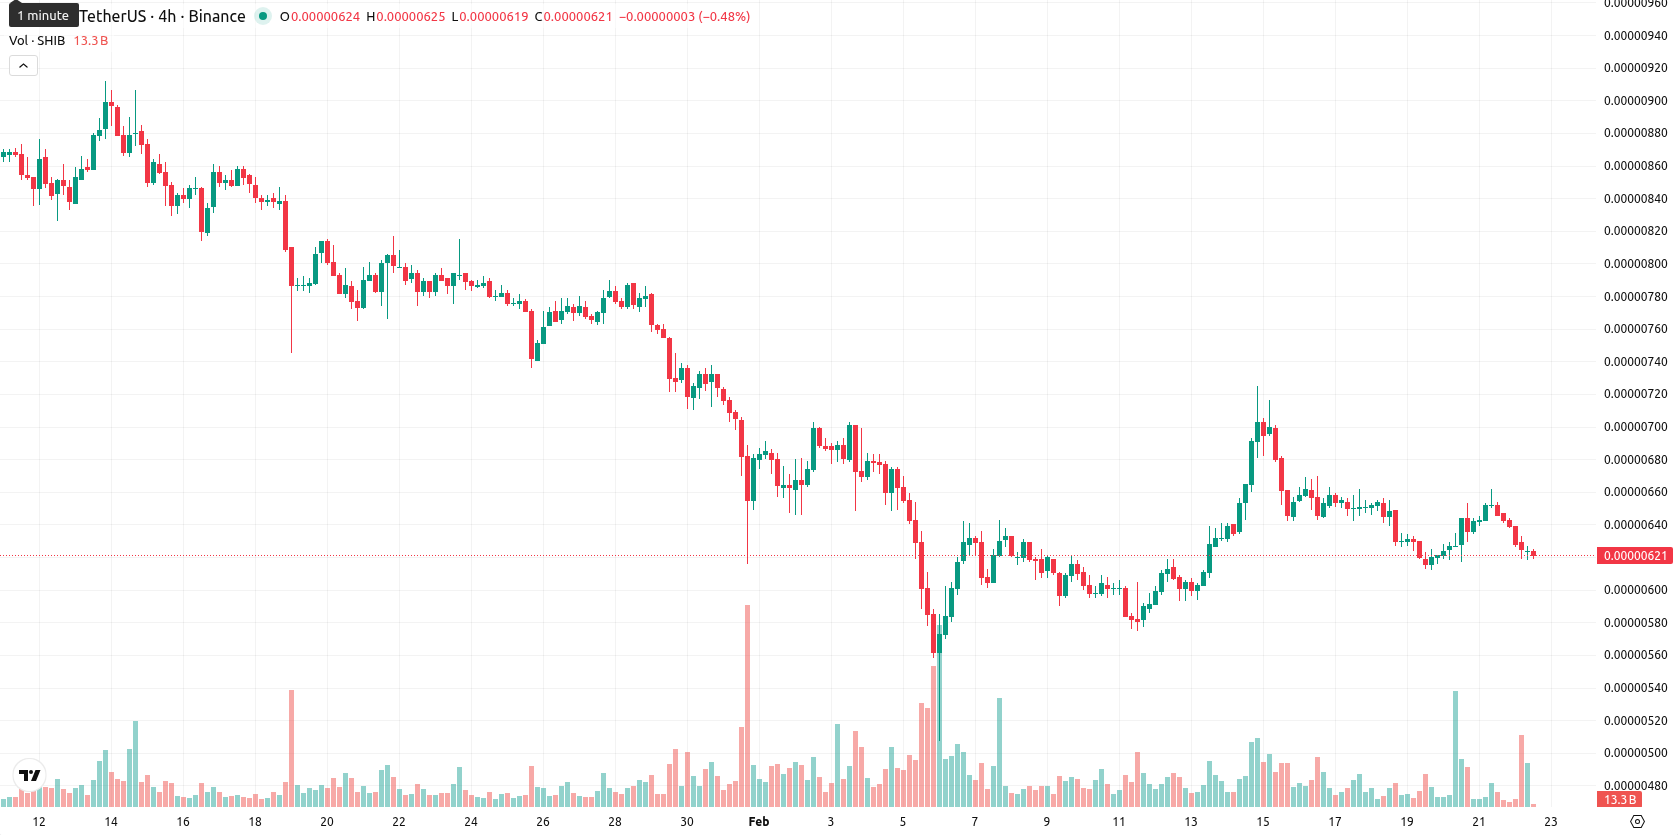
Shiba Inu (SHIB) is currently trading at $0.0000062, marking a clear weekly decline as the price slipped 4.61%. SHIB remains below its weekly MA-20 ($0.00000634), MA-50 ($0.00000743), and MA-200 ($0.00000974), signaling persistent downside momentum and seller control across all key timeframes.
Highlights
- SHIB trades below all major moving averages—MA-20 ($0.00000634), MA-50 ($0.00000743), and MA-200 ($0.00000974)—signaling persistent multi-timeframe bearish momentum.
- Daily and weekly MACD, RSI (44.98 D1, 34.63 W1), and a firm bearish ADX reading confirm weak momentum and ongoing selling pressure.
- SHIB's current price of $0.0000062 hovers near the daily low; support lies at $0.00000648 (Kijun), with resistance at MA-50 ($0.00000743), and a likely range of $0.00000560–$0.00000680 in the next 5 trading days.
Bearish momentum persists over the week with minor oversold signals
On the weekly chart, SHIB faces ongoing selling pressure with its price positioned below all major moving averages: MA-20, MA-50, and MA-200. The nearest dynamic support is provided by the Ichimoku Kijun at $0.00000648, while resistance is seen at the MA-50 near $0.00000743. Weekly RSI remains weak at 34.63, reflecting bearish momentum and a lack of strong buying interest. Additional weekly indicators — such as a bearish MACD and predominantly neutral oscillators — confirm the dominance of sellers while displaying only minor divergences suggesting mild oversold conditions.
Rangebound outlook expected next week amid weak momentum indicators
Looking ahead over the next 5–7 trading days, SHIB is likely to remain rangebound between $0.00000560 and $0.00000680, with a sideways or slightly bearish bias dominating. There is a less than 20% probability of a strong upward reversal, as negative signals from the weekly MACD, RSI, and all main moving averages persist. Should the price break above $0.00000680, a move toward higher resistances could unfold, but this scenario remains unlikely without a shift in momentum. Conversely, a drop below $0.00000560 would expose SHIB to further downside risks, continuing a prevailing bearish trend unless indicators turn more constructive.
Previously it was reported that Shiba Inu (SHIB) remains a sentiment-driven, highly volatile asset experiencing a prolonged decline amid diminished retail enthusiasm, with price action oscillating between support near recent lows and resistance at prior peaks. Technical indicators reflect weak trend momentum, with moving averages depressed and oscillators such as RSI and MACD offering little confirmation of a bullish reversal, underscoring the token’s sensitivity to retail flows and speculative cycles.


-
 Afghanistan
-
 Albania
-
 Algeria
-
 Angola
-
 Argentina
-
 Armenia
-
 Australia
-
 Austria
-
 Azerbaijan
-
 Bahamas
-
 Bahrain
-
 Bangladesh
-
 Belarus
-
 Belgium
-
 Bolivia
-
 Botswana
-
 Brazil
-
 Brunei
-
 Bulgaria
-
 Cambodia
-
 Cameroon
-
 Canada
-
 Chile
Chile
-
 China
China
-
 Colombia
-
 Congo
Congo
-
 Costa Rica
-
 Cote d'Ivoire
-
 Croatia
-
 Cuba
Cuba
-
 Cyprus
-
 Czechia
-
 DR Congo
-
 Denmark
-
 Dominican Republic
-
 Ecuador
-
 Egypt
Egypt
-
 El Salvador
-
 Estonia
-
 Eswatini
-
 Ethiopia
-
 Finland
-
 France
-
 Georgia
-
 Germany
-
 Ghana
Ghana
-
 Greece
-
 Haiti
Haiti
-
 Hong Kong
-
 Hungary
-
 India
India
-
 Indonesia
-
 Iran, Islamic republic
-
 Iraq
Iraq
-
 Ireland
-
 Israel
-
 Italy
Italy
-
 Jamaica
-
 Japan
Japan
-
 Jordan
-
 Kazakhstan
-
 Kenya
Kenya
-
 Korea
Korea
-
 Kuwait
-
 Kyrgyzstan
-
 Laos
Laos
-
 Latvia
-
 Lebanon
-
 Lesotho
-
 Libya
Libya
-
 Lithuania
-
 Luxembourg
-
 Madagascar
-
 Malaysia
-
 Malta
Malta
-
 Mauritius
-
 Mexico
-
 Moldova
-
 Mongolia
-
 Montenegro
-
 Morocco
-
 Mozambique
-
 Myanmar
-
 Namibia
-
 Nepal
Nepal
-
 Netherlands
-
 New Zealand
-
 Nigeria
-
 North Macedonia
-
 Norway
-
 Oman
Oman
-
 Pakistan
-
 Palestine
-
 Panama
-
 Papua New Guinea
-
 Paraguay
-
 Peru
Peru
-
 Philippines
-
 Poland
-
 Portugal
-
 Puerto Rico
-
 Qatar
Qatar
-
 Reunion
-
 Romania
-
 Rwanda
-
 Saudi Arabia
-
 Serbia
-
 Singapore
-
 Slovakia
-
 Slovenia
-
 Somalia
-
 South Africa
-
 Spain
Spain
-
 Sri Lanka
-
 Sweden
-
 Switzerland
-
 Syria
Syria
-
 Taiwan
-
 Tajikistan
-
 Tanzania
-
 Thailand
-
 Trinidad and Tobago
-
 Tunisia
-
 Turkey
-
 UAE
UAE
-
 Uganda
-
 Ukraine
-
 United Kingdom
-
United States
-
 Uruguay
-
 Uzbekistan
-
 Venezuela
-
 Vietnam
-
 Yemen
Yemen
-
 Zambia
-
 Zimbabwe
- Forex
- Crypto
