
DeXe price prediction: Sideways range likely as DEXE gains 13.42% despite bearish weekly signals

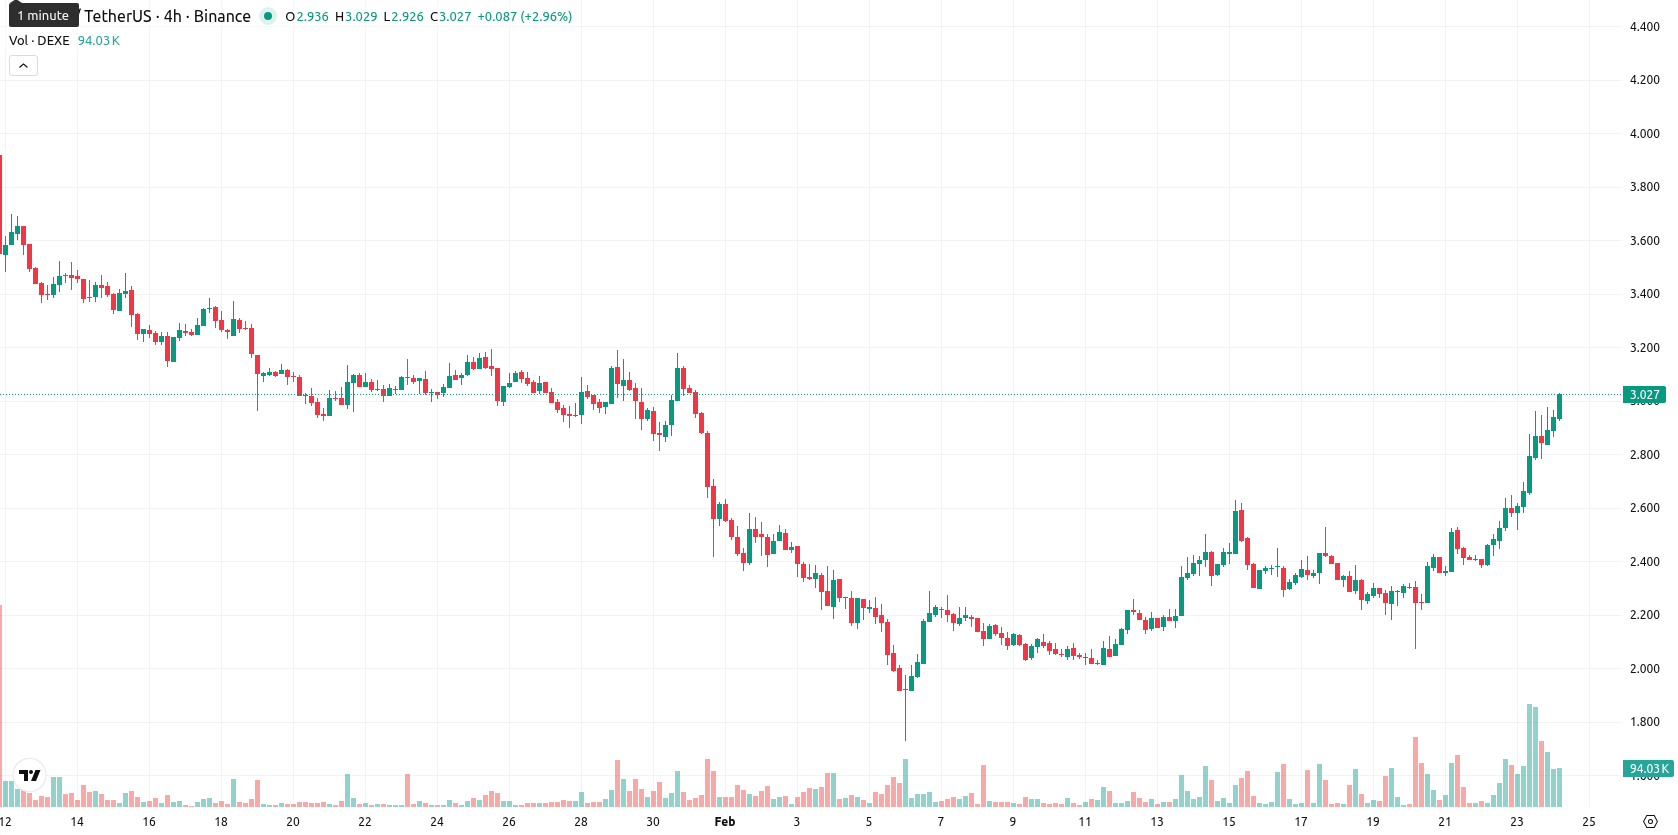
DeXe (DEXE) is trading at $3.02, which is above both its MA-20 at $2.29 and MA-50 at $2.79, but remains well below the MA-200 at $5.51. This setup confirms a bullish short- and medium-term structure while the longer-term trend still faces overhead resistance. The Ichimoku Kijun level at $2.46 sits below the current price, acting as immediate support.
Highlights
- DEXE trades at $3.02, above its MA-20 ($2.29) and MA-50 ($2.79), but remains well below the longer-term MA-200 at $5.51, reflecting short- and medium-term bullishness versus long-term weakness.
- Multiple intraday oscillators (Stochastic RSI at 100.00, CCI at 233.30, Bull/Bear Power at 0.53) show overbought conditions and strong buyer dominance, though daily and weekly MACD signal underlying bearish momentum.
- Expect DEXE to trade between $2.70 and $3.25 with a low probability (<20%) of further upside, while losing $2.70 support could trigger additional downside in line with bearish weekly indicators.
Intraday buyer dominance as momentum signals diverge by timeframe
Momentum signals are mixed: MACD indicates strong selling pressure on the daily and weekly timeframes, though short-term MACD signals are bullish. ADX on the daily is neutral, signaling a lack of strong trend, while the daily RSI at 63.31 shows buyers are present but not yet at extreme levels. Multiple oscillators (Stochastic RSI at 100.00, CCI at 233.30, and Bull/Bear Power at 0.53) indicate overbought conditions and clear buyer dominance intraday. The Awesome Oscillator is neutral, not lending clear confirmation. Prices opened with a gap up from the previous close ($2.66 to $2.89) and continue to trade near session highs within a volatile, upward-trending session, with persistent strength after the open. This strong intraday momentum slightly diverges with broader, longer-term momentum, where several signals remain bearish.
Downside bias as bearish indicators outweigh short-term strength
For the next five trading days, the expected normalized price range is $2.70 – $3.25, centered around the current market level. The probability of further price increase is very low (less than 20%), making a decrease more likely given consistently bearish weekly signals across all major indicators. In the baseline scenario, DEXE hovers within a sideways corridor between recent support and resistance. A bullish scenario unfolds if buyers reclaim $3.25, targeting higher levels with strong short-term momentum. In a bearish case, losing support at $2.70 could expose DEXE to further downside, in line with prevailing longer-term weakness.
Previously it was reported that DeXe is exhibiting short-term bullish momentum with the price holding above key short-term moving averages, though persistent resistance near the MA-50 and significant long-term pressure below the MA-200 remain. Momentum signals are mixed, as the MACD reflects ongoing bearish sentiment while RSI is moderately bullish, with overbought oscillator readings suggesting potential for near-term exhaustion and range-bound volatility between support around $2.46 and resistance near $2.80.


-
 Afghanistan
-
 Albania
-
 Algeria
-
 Angola
-
 Argentina
-
 Armenia
-
 Australia
-
 Austria
-
 Azerbaijan
-
 Bahamas
-
 Bahrain
-
 Bangladesh
-
 Belarus
-
 Belgium
-
 Bolivia
-
 Botswana
-
 Brazil
-
 Brunei
-
 Bulgaria
-
 Cambodia
-
 Cameroon
-
 Canada
-
 Chile
Chile
-
 China
China
-
 Colombia
-
 Congo
Congo
-
 Costa Rica
-
 Cote d'Ivoire
-
 Croatia
-
 Cuba
Cuba
-
 Cyprus
-
 Czechia
-
 DR Congo
-
 Denmark
-
 Dominican Republic
-
 Ecuador
-
 Egypt
Egypt
-
 El Salvador
-
 Estonia
-
 Eswatini
-
 Ethiopia
-
 Finland
-
 France
-
 Georgia
-
 Germany
-
 Ghana
Ghana
-
 Greece
-
 Haiti
Haiti
-
 Hong Kong
-
 Hungary
-
 India
India
-
 Indonesia
-
 Iran, Islamic republic
-
 Iraq
Iraq
-
 Ireland
-
 Israel
-
 Italy
Italy
-
 Jamaica
-
 Japan
Japan
-
 Jordan
-
 Kazakhstan
-
 Kenya
Kenya
-
 Korea
Korea
-
 Kuwait
-
 Kyrgyzstan
-
 Laos
Laos
-
 Latvia
-
 Lebanon
-
 Lesotho
-
 Libya
Libya
-
 Lithuania
-
 Luxembourg
-
 Madagascar
-
 Malaysia
-
 Malta
Malta
-
 Mauritius
-
 Mexico
-
 Moldova
-
 Mongolia
-
 Montenegro
-
 Morocco
-
 Mozambique
-
 Myanmar
-
 Namibia
-
 Nepal
Nepal
-
 Netherlands
-
 New Zealand
-
 Nigeria
-
 North Macedonia
-
 Norway
-
 Oman
Oman
-
 Pakistan
-
 Palestine
-
 Panama
-
 Papua New Guinea
-
 Paraguay
-
 Peru
Peru
-
 Philippines
-
 Poland
-
 Portugal
-
 Puerto Rico
-
 Qatar
Qatar
-
 Reunion
-
 Romania
-
 Rwanda
-
 Saudi Arabia
-
 Serbia
-
 Singapore
-
 Slovakia
-
 Slovenia
-
 Somalia
-
 South Africa
-
 Spain
Spain
-
 Sri Lanka
-
 Sweden
-
 Switzerland
-
 Syria
Syria
-
 Taiwan
-
 Tajikistan
-
 Tanzania
-
 Thailand
-
 Trinidad and Tobago
-
 Tunisia
-
 Turkey
-
 UAE
UAE
-
 Uganda
-
 Ukraine
-
 United Kingdom
-
United States
-
 Uruguay
-
 Uzbekistan
-
 Venezuela
-
 Vietnam
-
 Yemen
Yemen
-
 Zambia
-
 Zimbabwe
- Forex
- Crypto
