
SUI declines as RSI and CCI approach oversold territory, signaling continued downside risks – weekly analysis

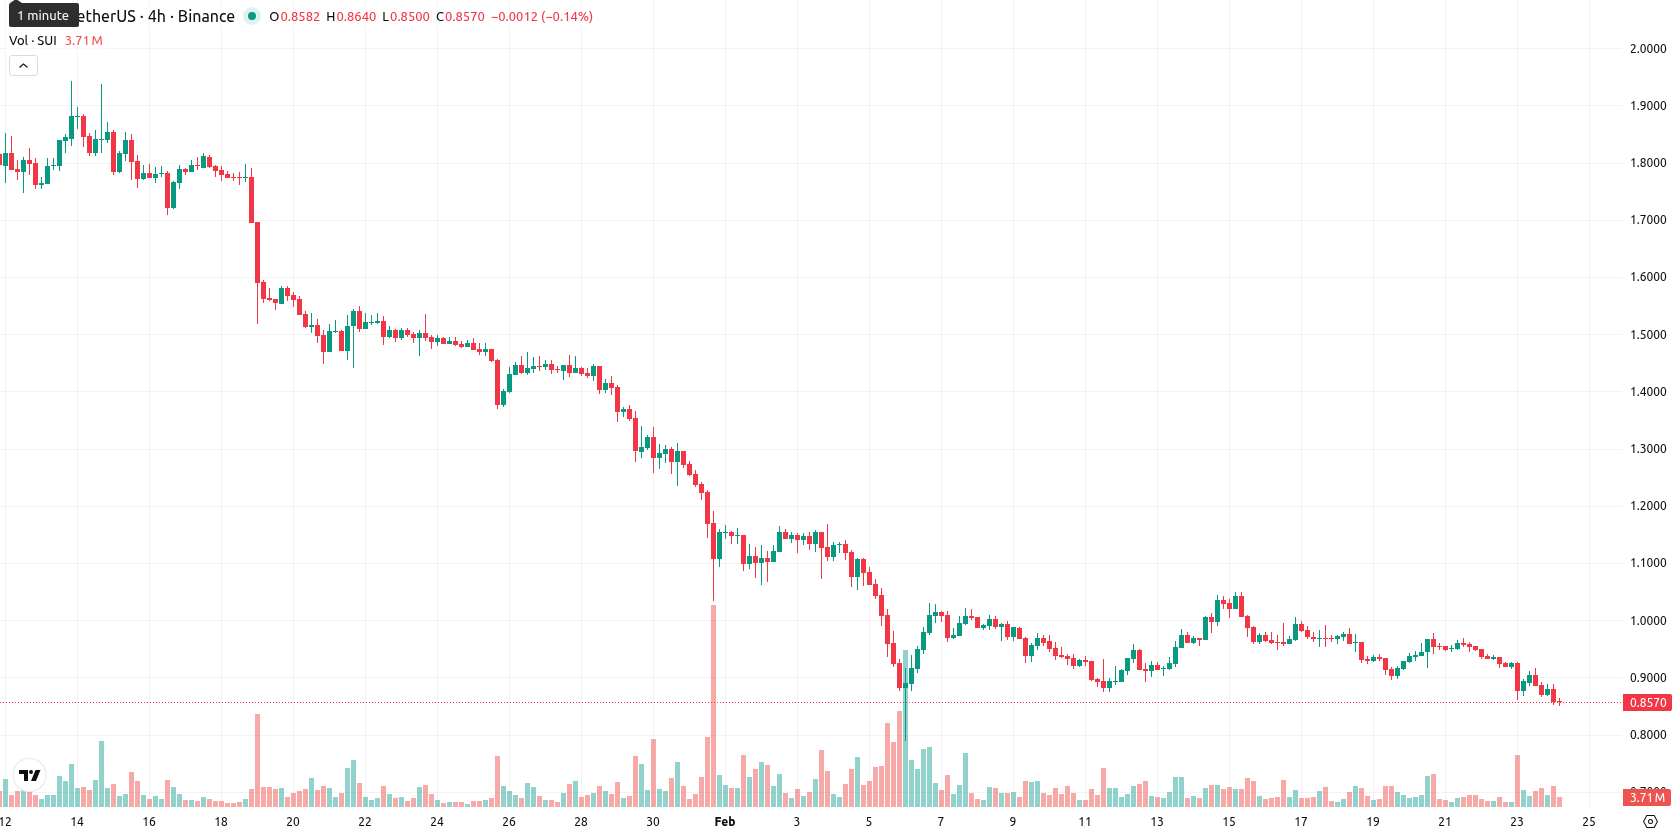
Sui (SUI) is currently trading at $0.8593, marking a notable move lower over the past week and standing well below its MA-20 ($0.9582), MA-50 ($1.3276), and MA-200 ($2.2601) on the W1 chart. This places SUI in a clearly bearish stance against its key moving averages on the weekly timeframe.
Highlights
- SUI is trading at $0.8593, well below its MA-20 ($0.9582), MA-50 ($1.3276), and MA-200 ($2.2601), confirming entrenched bearish momentum across all timeframes.
- Momentum indicators including MACD, ADX, RSI (32.38), and CCI (–146) remain in strong sell territory, with oversold signals suggesting short-term exhaustion but no imminent reversal.
- For the next five trading days, SUI is expected to fluctuate between $0.82 and $0.93, with the probability of further decline considerably higher than a price increase.
Bearish momentum intensifies as indicators approach oversold levels this week
Weekly technical analysis for SUI underscores persistent bearish momentum. The asset has broken beneath all major weekly moving averages, with the closest dynamic resistance at the Ichimoku Kijun level of $1.0996 and provisional support at recent lows near $0.8515. Weekly momentum indicators, including MACD and ADX, signal strong selling pressure, while RSI (32.38), CCI (–146), and Stochastic RSI are approaching oversold territory, suggesting short-term exhaustion but not a clear reversal. Continued dominance by sellers is confirmed by negative Bull/Bear Power values and a session that remains close to the lower end of this week’s trading range.
Range-bound outlook expected as sellers keep control into next week
Looking ahead, SUI is likely to remain range-bound between $0.82 and $0.93 for the next five to seven trading days, reflecting normalized volatility and current price action. The absence of bullish signals on the W1 RSI, ADX, MACD, and moving averages points to a low probability of recovery, with a prolonged phase of sideways movement near recent lows as the baseline scenario. Should oversold conditions trigger a rebound, SUI may test resistance near $0.93 — $1.10, but prevailing momentum overwhelmingly favors further downside, particularly if support at $0.82 fails to hold.
Previously it was reported that SUI remains under persistent downward pressure, trading below all key moving averages and the Ichimoku Kijun, with technical indicators such as MACD signaling strong sell momentum and RSI levels approaching oversold conditions. Immediate resistance is noted at $1.14, with support near $0.92, and near-term price action is expected to consolidate within a defined range, favoring continued weakness unless a decisive breakout occurs.


-
 Afghanistan
-
 Albania
-
 Algeria
-
 Angola
-
 Argentina
-
 Armenia
-
 Australia
-
 Austria
-
 Azerbaijan
-
 Bahamas
-
 Bahrain
-
 Bangladesh
-
 Belarus
-
 Belgium
-
 Bolivia
-
 Botswana
-
 Brazil
-
 Brunei
-
 Bulgaria
-
 Cambodia
-
 Cameroon
-
 Canada
-
 Chile
Chile
-
 China
China
-
 Colombia
-
 Congo
Congo
-
 Costa Rica
-
 Cote d'Ivoire
-
 Croatia
-
 Cuba
Cuba
-
 Cyprus
-
 Czechia
-
 DR Congo
-
 Denmark
-
 Dominican Republic
-
 Ecuador
-
 Egypt
Egypt
-
 El Salvador
-
 Estonia
-
 Eswatini
-
 Ethiopia
-
 Finland
-
 France
-
 Georgia
-
 Germany
-
 Ghana
Ghana
-
 Greece
-
 Haiti
Haiti
-
 Hong Kong
-
 Hungary
-
 India
India
-
 Indonesia
-
 Iran, Islamic republic
-
 Iraq
Iraq
-
 Ireland
-
 Israel
-
 Italy
Italy
-
 Jamaica
-
 Japan
Japan
-
 Jordan
-
 Kazakhstan
-
 Kenya
Kenya
-
 Korea
Korea
-
 Kuwait
-
 Kyrgyzstan
-
 Laos
Laos
-
 Latvia
-
 Lebanon
-
 Lesotho
-
 Libya
Libya
-
 Lithuania
-
 Luxembourg
-
 Madagascar
-
 Malaysia
-
 Malta
Malta
-
 Mauritius
-
 Mexico
-
 Moldova
-
 Mongolia
-
 Montenegro
-
 Morocco
-
 Mozambique
-
 Myanmar
-
 Namibia
-
 Nepal
Nepal
-
 Netherlands
-
 New Zealand
-
 Nigeria
-
 North Macedonia
-
 Norway
-
 Oman
Oman
-
 Pakistan
-
 Palestine
-
 Panama
-
 Papua New Guinea
-
 Paraguay
-
 Peru
Peru
-
 Philippines
-
 Poland
-
 Portugal
-
 Puerto Rico
-
 Qatar
Qatar
-
 Reunion
-
 Romania
-
 Rwanda
-
 Saudi Arabia
-
 Serbia
-
 Singapore
-
 Slovakia
-
 Slovenia
-
 Somalia
-
 South Africa
-
 Spain
Spain
-
 Sri Lanka
-
 Sweden
-
 Switzerland
-
 Syria
Syria
-
 Taiwan
-
 Tajikistan
-
 Tanzania
-
 Thailand
-
 Trinidad and Tobago
-
 Tunisia
-
 Turkey
-
 UAE
UAE
-
 Uganda
-
 Ukraine
-
 United Kingdom
-
United States
-
 Uruguay
-
 Uzbekistan
-
 Venezuela
-
 Vietnam
-
 Yemen
Yemen
-
 Zambia
-
 Zimbabwe
- Forex
- Crypto
