
Kava: Strong downside momentum extends selloff after failed support levels

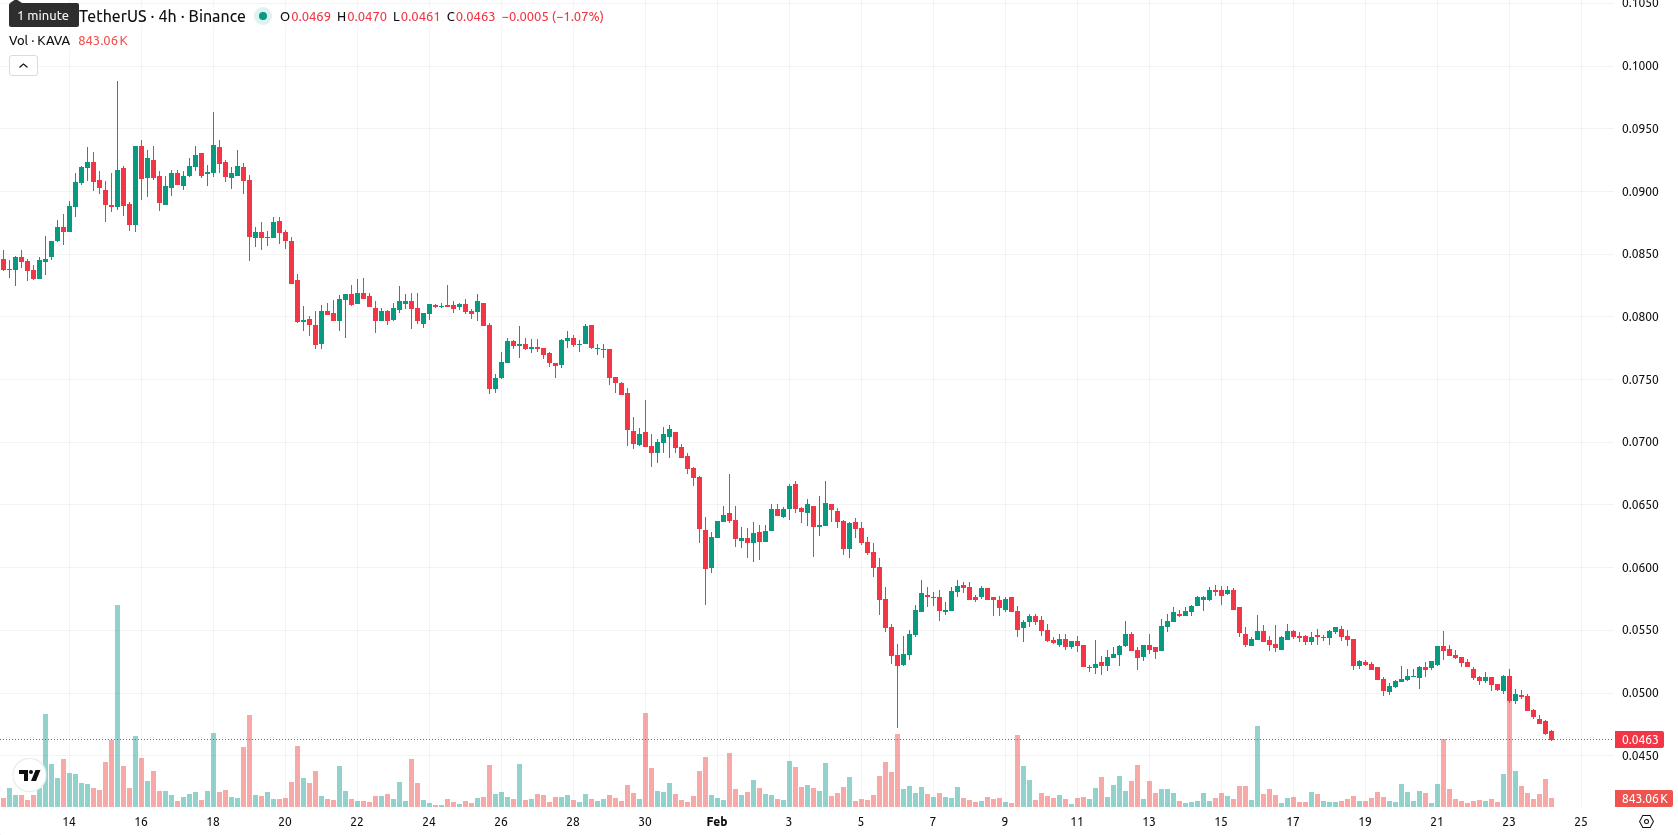
Kava (KAVA) is trading at $0.0463, which is well below the MA-20 ($0.0545), MA-50 ($0.0703), and MA-200 ($0.1821), indicating persistent pressure from sellers across short, medium, and long-term trends. The Ichimoku Kijun sits at $0.0623, which is above the current price and acts as immediate resistance.
Highlights
- KAVA trades at $0.0463, well below the MA-20 ($0.0545), MA-50 ($0.0703), and MA-200 ($0.1821), indicating pronounced bearish pressure across all timeframes.
- Momentum and sentiment indicators (MACD strong sell, ADX elevated, RSI 29.46, CCI -167.79) confirm an oversold market with robust downside momentum.
- Next five days see a high probability (>80%) of KAVA moving within $0.0417–$0.0509; resistance sits at $0.0623, while a breach below $0.0417 risks accelerating declines.
Oversold signals intensify as high volatility sustains downtrend
Momentum indicators signal pronounced bearishness, with the MACD showing strong sell and the ADX remaining elevated, confirming a robust downtrend. RSI (29.46), Stochastic RSI (13.99), and CCI (-167.79) all highlight oversold conditions, while Bull/Bear Power points to dominant sellers intraday. There was a slight gap down at the open, and the price is now near the low of today’s range, following a steep daily drop of 7.03%. Volatility is high, with heavy pressure after the open and intraday signals aligned to further downside momentum.
Bearish continuation likely as recovery stalls below resistance
For the next five trading days, a conservative and volatility-adjusted price range is expected between $0.0417 and $0.0509. The probability of a further decline is very high (more than 80%), while a sustained recovery is much less likely. In the baseline scenario, KAVA trades sideways within this volatility band relative to current levels. A bullish scenario would require a break above the $0.0623 resistance to trigger short-term upside interest, while a move below $0.0417 could accelerate declines and renew selling pressure.
Previously it was reported that Kava continues to face strong bearish momentum, trading well below all major moving averages with all key momentum indicators reflecting sustained selling pressure and oversold conditions. Immediate resistance is at the Ichimoku Kijun, while price action remains confined to the lower end of its recent range, with further downside risk dominating unless a catalyst emerges to reverse the trend.


-
 Afghanistan
-
 Albania
-
 Algeria
-
 Angola
-
 Argentina
-
 Armenia
-
 Australia
-
 Austria
-
 Azerbaijan
-
 Bahamas
-
 Bahrain
-
 Bangladesh
-
 Belarus
-
 Belgium
-
 Bolivia
-
 Botswana
-
 Brazil
-
 Brunei
-
 Bulgaria
-
 Cambodia
-
 Cameroon
-
 Canada
-
 Chile
Chile
-
 China
China
-
 Colombia
-
 Congo
Congo
-
 Costa Rica
-
 Cote d'Ivoire
-
 Croatia
-
 Cuba
Cuba
-
 Cyprus
-
 Czechia
-
 DR Congo
-
 Denmark
-
 Dominican Republic
-
 Ecuador
-
 Egypt
Egypt
-
 El Salvador
-
 Estonia
-
 Eswatini
-
 Ethiopia
-
 Finland
-
 France
-
 Georgia
-
 Germany
-
 Ghana
Ghana
-
 Greece
-
 Haiti
Haiti
-
 Hong Kong
-
 Hungary
-
 India
India
-
 Indonesia
-
 Iran, Islamic republic
-
 Iraq
Iraq
-
 Ireland
-
 Israel
-
 Italy
Italy
-
 Jamaica
-
 Japan
Japan
-
 Jordan
-
 Kazakhstan
-
 Kenya
Kenya
-
 Korea
Korea
-
 Kuwait
-
 Kyrgyzstan
-
 Laos
Laos
-
 Latvia
-
 Lebanon
-
 Lesotho
-
 Libya
Libya
-
 Lithuania
-
 Luxembourg
-
 Madagascar
-
 Malaysia
-
 Malta
Malta
-
 Mauritius
-
 Mexico
-
 Moldova
-
 Mongolia
-
 Montenegro
-
 Morocco
-
 Mozambique
-
 Myanmar
-
 Namibia
-
 Nepal
Nepal
-
 Netherlands
-
 New Zealand
-
 Nigeria
-
 North Macedonia
-
 Norway
-
 Oman
Oman
-
 Pakistan
-
 Palestine
-
 Panama
-
 Papua New Guinea
-
 Paraguay
-
 Peru
Peru
-
 Philippines
-
 Poland
-
 Portugal
-
 Puerto Rico
-
 Qatar
Qatar
-
 Reunion
-
 Romania
-
 Rwanda
-
 Saudi Arabia
-
 Serbia
-
 Singapore
-
 Slovakia
-
 Slovenia
-
 Somalia
-
 South Africa
-
 Spain
Spain
-
 Sri Lanka
-
 Sweden
-
 Switzerland
-
 Syria
Syria
-
 Taiwan
-
 Tajikistan
-
 Tanzania
-
 Thailand
-
 Trinidad and Tobago
-
 Tunisia
-
 Turkey
-
 UAE
UAE
-
 Uganda
-
 Ukraine
-
 United Kingdom
-
United States
-
 Uruguay
-
 Uzbekistan
-
 Venezuela
-
 Vietnam
-
 Yemen
Yemen
-
 Zambia
-
 Zimbabwe
- Forex
- Crypto
