
+7.42% for Sui — ETF debut and distribution surge spark institutional interest

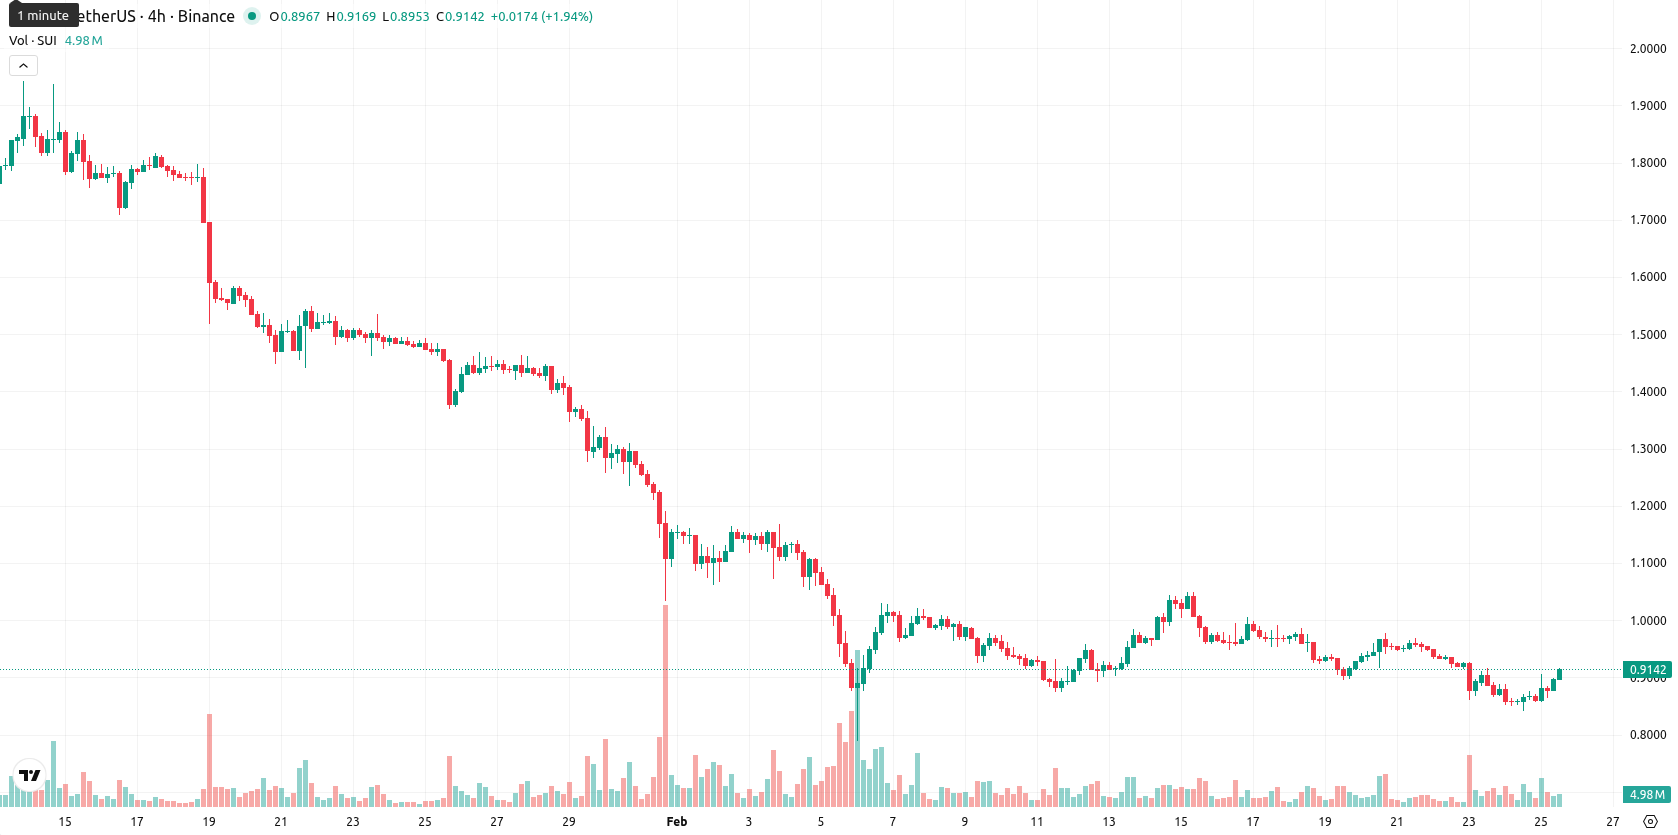
Sui (SUI) is trading at $0.9119, up 7.42% on the day and holding below all key moving averages. The asset remains under firm short-, medium-, and long-term bearish pressure, with prices still beneath the MA-20 ($0.9470), MA-50 ($1.3068), and MA-200 ($2.2452).
Highlights
- The 21Shares Spot SUI ETF (TSUI) launches on Nasdaq February 24, 2026, granting U.S. investors regulated access to the Sui blockchain via an ETF platform.
- Sui led the week's token unlock activity with a $48.87 million release, signaling heightened period-specific token distribution and increased float.
- SUI trades at $0.9119 below major moving averages (MA-20/50/200), with strong bearish momentum and a likely range of $0.83–$0.99 over the next five days.
Institutional access expands as ETF launch and token unlock drive flows
The launch of the 21Shares Spot SUI ETF (TSUI) on Nasdaq on February 24, 2026, now offers U.S. investors direct, regulated access to the Sui blockchain via an established exchange-traded fund. This milestone expands both institutional and retail participation in Sui through a mainstream brokerage channel, reflecting accelerating institutional interest. Separately, Sui led weekly token unlock activity with a $48.87 million release, highlighting heightened distribution for the period.
Bearish momentum dominates as key indicators diverge and volatility rises
Technically, SUI continues to trade below the MA-20, MA-50, and MA-200, underscoring persistent bearish bias in the short, medium, and long term. The current Ichimoku Kijun level at $1.0626 acts as immediate resistance, while momentum is negative as confirmed by strong sell signals from both daily and weekly MACD, and a strong bearish ADX reading, especially on the daily chart. RSI and CCI indicate oversold conditions, whereas the Stochastic RSI is neutral on D1 but presents overbought signals on shorter intraday timeframes, creating a notable divergence. Bull/Bear Power shows sustained seller dominance and the Awesome Oscillator is neutral, while price action today is marked by an intraday gain, an upward gap, and above-average volatility with trading near session highs.
Sideways trading outlook as low breakout odds meet persistent selling signals
Over the next five trading days, SUI is expected to remain within a typical volatility band of $0.83 to $0.99, centered near current levels. The probability of significant upside moves is low, at less than 20%, as multiple weekly indicators continue to signal further selling. The most likely scenario is sideways movement for SUI within the $0.83–$0.99 range. A bullish breakout above $1.0626 could open space for recovery, while a bearish move below $0.83 may accelerate declines given the ongoing negative momentum.
Last time, analysts noted that SUI remains firmly bearish on the weekly timeframe, trading below all key moving averages with strong selling pressure reflected in momentum indicators, as RSI and CCI approach oversold levels and MACD/ADX confirm continued downside momentum. Immediate outlook suggests SUI will remain range-bound near recent lows with resistance around $0.93–$1.10 and critical support at $0.82, as no clear bullish reversal signals have emerged.


-
 Afghanistan
-
 Albania
-
 Algeria
-
 Angola
-
 Argentina
-
 Armenia
-
 Australia
-
 Austria
-
 Azerbaijan
-
 Bahamas
-
 Bahrain
-
 Bangladesh
-
 Belarus
-
 Belgium
-
 Bolivia
-
 Botswana
-
 Brazil
-
 Brunei
-
 Bulgaria
-
 Cambodia
-
 Cameroon
-
 Canada
-
 Chile
Chile
-
 China
China
-
 Colombia
-
 Congo
Congo
-
 Costa Rica
-
 Cote d'Ivoire
-
 Croatia
-
 Cuba
Cuba
-
 Cyprus
-
 Czechia
-
 DR Congo
-
 Denmark
-
 Dominican Republic
-
 Ecuador
-
 Egypt
Egypt
-
 El Salvador
-
 Estonia
-
 Eswatini
-
 Ethiopia
-
 Finland
-
 France
-
 Georgia
-
 Germany
-
 Ghana
Ghana
-
 Greece
-
 Haiti
Haiti
-
 Hong Kong
-
 Hungary
-
 India
India
-
 Indonesia
-
 Iran, Islamic republic
-
 Iraq
Iraq
-
 Ireland
-
 Israel
-
 Italy
Italy
-
 Jamaica
-
 Japan
Japan
-
 Jordan
-
 Kazakhstan
-
 Kenya
Kenya
-
 Korea
Korea
-
 Kuwait
-
 Kyrgyzstan
-
 Laos
Laos
-
 Latvia
-
 Lebanon
-
 Lesotho
-
 Libya
Libya
-
 Lithuania
-
 Luxembourg
-
 Madagascar
-
 Malaysia
-
 Malta
Malta
-
 Mauritius
-
 Mexico
-
 Moldova
-
 Mongolia
-
 Montenegro
-
 Morocco
-
 Mozambique
-
 Myanmar
-
 Namibia
-
 Nepal
Nepal
-
 Netherlands
-
 New Zealand
-
 Nigeria
-
 North Macedonia
-
 Norway
-
 Oman
Oman
-
 Pakistan
-
 Palestine
-
 Panama
-
 Papua New Guinea
-
 Paraguay
-
 Peru
Peru
-
 Philippines
-
 Poland
-
 Portugal
-
 Puerto Rico
-
 Qatar
Qatar
-
 Reunion
-
 Romania
-
 Rwanda
-
 Saudi Arabia
-
 Serbia
-
 Singapore
-
 Slovakia
-
 Slovenia
-
 Somalia
-
 South Africa
-
 Spain
Spain
-
 Sri Lanka
-
 Sweden
-
 Switzerland
-
 Syria
Syria
-
 Taiwan
-
 Tajikistan
-
 Tanzania
-
 Thailand
-
 Trinidad and Tobago
-
 Tunisia
-
 Turkey
-
 UAE
UAE
-
 Uganda
-
 Ukraine
-
 United Kingdom
-
United States
-
 Uruguay
-
 Uzbekistan
-
 Venezuela
-
 Vietnam
-
 Yemen
Yemen
-
 Zambia
-
 Zimbabwe
- Forex
- Crypto
