
Chainlink price prediction: Upside capped despite bullish move? LINK jumps 8.47%

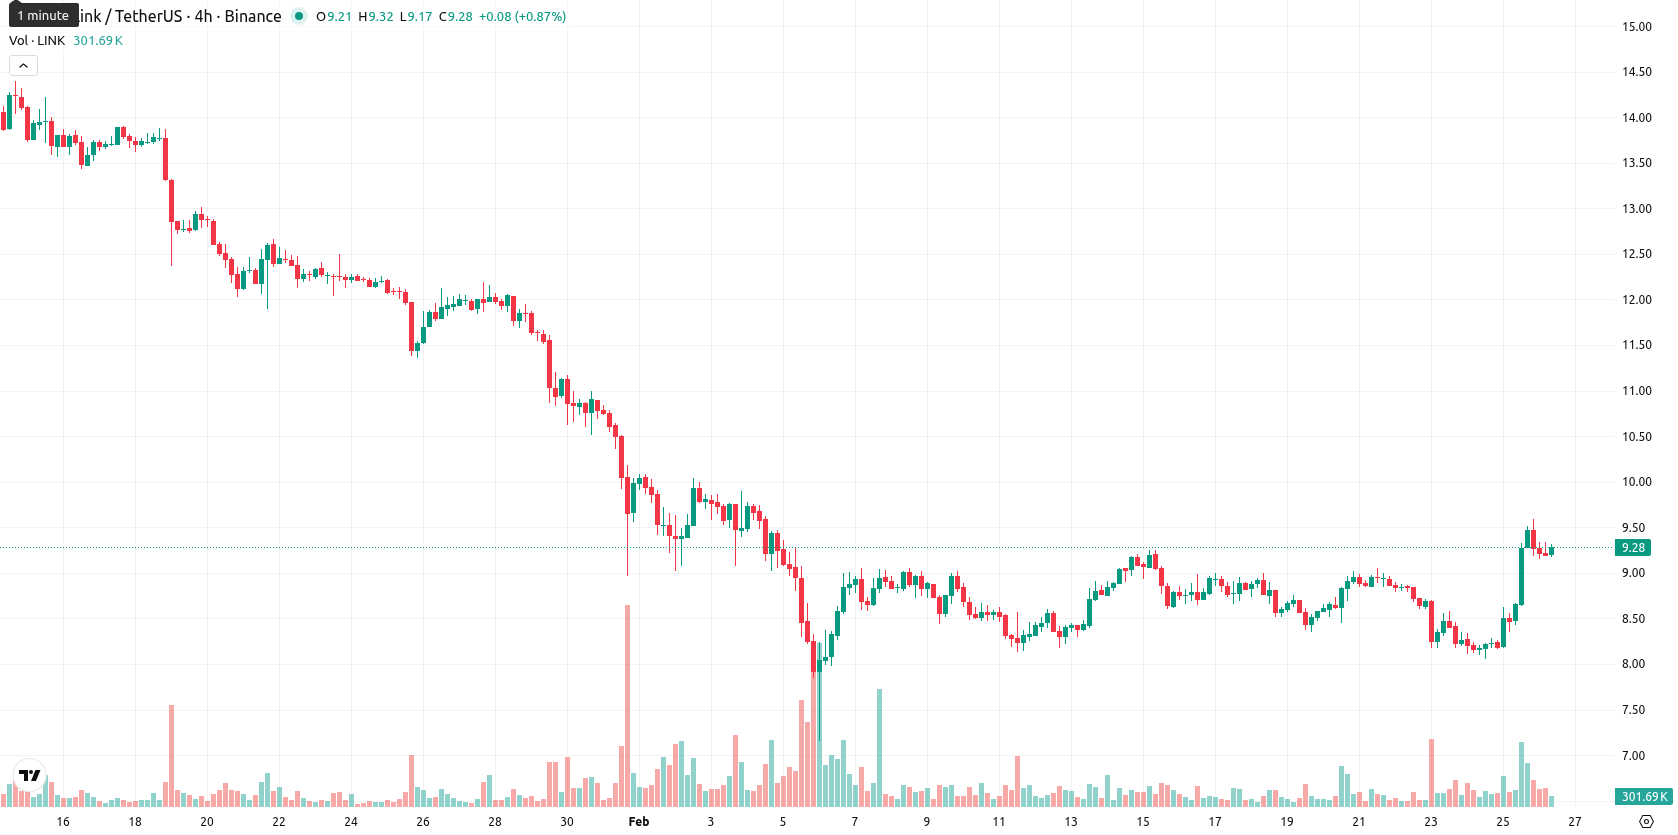
Chainlink (LINK) is trading at $9.30 after a robust 8.47% daily gain. The price is trading above the MA-20 ($8.73), but remains below both the MA-50 ($10.72) and the MA-200 ($16.27), highlighting a short-term bullish posture set against persistent medium- and long-term downward pressure.
Highlights
- Chainlink has integrated with the Canton Network, enabling real-time data services for institutional blockchain use cases and elevating Chainlink Labs to Canton Super Validator.
- Institutional interest in LINK continues to strengthen, with Grayscale surpassing 5 million tokens held and Strategic LINK Reserves reaching over 2.17 million tokens worth $19.7 million.
- LINK trades at $9.30, above immediate support at $9.00 but faces resistance at $9.80, with low probability (<20%) of sustained upside and heightened near-term pullback risk.
Institutional flows and network milestones drive strategic repositioning
Chainlink recently completed its integration with the Canton Network, expanding access to real-time pricing, valuation, and proof-of-reserve data for institutional blockchain applications. Chainlink Labs has become a Canton Super Validator, assuming governance and sequencing responsibilities within the network. Additionally, Taylor Lindman, former deputy general counsel at Chainlink Labs, has taken a new regulatory position as chief counsel of the US SEC's Crypto Task Force, while institutional holdings in LINK continue to grow, with Grayscale surpassing 5 million tokens and Strategic LINK Reserves exceeding 2.17 million tokens valued at over $19.7 million.
Intraday bullish signals clash with daily overbought conditions and support
Momentum signals are mixed: daily MACD remains on a strong sell while ADX signals persistent trend strength to the downside, yet intraday readings (MACD, ADX) turn bullish in shorter intervals. RSI is neutral-to-bullish on the daily chart, but oscillators like Stochastic RSI and CCI are overbought, indicating caution for further upside. Bull/Bear Power shows strong buyer dominance intraday, aligning with today's robust gain, as the price trades near session highs within a moderately wide range. The Ichimoku Kijun level at $9.00 provides immediate support for LINK.
Limited upside seen as volatility bands constrain near-term moves
Over the next five trading days, LINK price is likely to move within a volatility band of $8.40 to $9.80 relative to current levels. Upside potential appears limited, with less than a 20% probability of further increases. A break above $9.80 could trigger short squeezes, while a drop below $8.40 might prompt renewed downside toward medium-term lows, given ongoing negative weekly momentum and strong overhead resistance. Sideways consolidation or a near-term pullback is the most probable scenario.
Previously it was reported that Chainlink (LINK) is exhibiting short-term bullish momentum, trading above its 20-day moving average but still below its 50- and 200-day averages, reflecting continued medium- and long-term resistance. While intraday action remains strong with buyers dominating, mixed momentum indicators and overbought oscillators suggest caution as the asset approaches key resistance levels near $10.00.


-
 Afghanistan
-
 Albania
-
 Algeria
-
 Angola
-
 Argentina
-
 Armenia
-
 Australia
-
 Austria
-
 Azerbaijan
-
 Bahamas
-
 Bahrain
-
 Bangladesh
-
 Belarus
-
 Belgium
-
 Bolivia
-
 Botswana
-
 Brazil
-
 Brunei
-
 Bulgaria
-
 Cambodia
-
 Cameroon
-
 Canada
-
 Chile
Chile
-
 China
China
-
 Colombia
-
 Congo
Congo
-
 Costa Rica
-
 Cote d'Ivoire
-
 Croatia
-
 Cuba
Cuba
-
 Cyprus
-
 Czechia
-
 DR Congo
-
 Denmark
-
 Dominican Republic
-
 Ecuador
-
 Egypt
Egypt
-
 El Salvador
-
 Estonia
-
 Eswatini
-
 Ethiopia
-
 Finland
-
 France
-
 Georgia
-
 Germany
-
 Ghana
Ghana
-
 Greece
-
 Haiti
Haiti
-
 Hong Kong
-
 Hungary
-
 India
India
-
 Indonesia
-
 Iran, Islamic republic
-
 Iraq
Iraq
-
 Ireland
-
 Israel
-
 Italy
Italy
-
 Jamaica
-
 Japan
Japan
-
 Jordan
-
 Kazakhstan
-
 Kenya
Kenya
-
 Korea
Korea
-
 Kuwait
-
 Kyrgyzstan
-
 Laos
Laos
-
 Latvia
-
 Lebanon
-
 Lesotho
-
 Libya
Libya
-
 Lithuania
-
 Luxembourg
-
 Madagascar
-
 Malaysia
-
 Malta
Malta
-
 Mauritius
-
 Mexico
-
 Moldova
-
 Mongolia
-
 Montenegro
-
 Morocco
-
 Mozambique
-
 Myanmar
-
 Namibia
-
 Nepal
Nepal
-
 Netherlands
-
 New Zealand
-
 Nigeria
-
 North Macedonia
-
 Norway
-
 Oman
Oman
-
 Pakistan
-
 Palestine
-
 Panama
-
 Papua New Guinea
-
 Paraguay
-
 Peru
Peru
-
 Philippines
-
 Poland
-
 Portugal
-
 Puerto Rico
-
 Qatar
Qatar
-
 Reunion
-
 Romania
-
 Rwanda
-
 Saudi Arabia
-
 Serbia
-
 Singapore
-
 Slovakia
-
 Slovenia
-
 Somalia
-
 South Africa
-
 Spain
Spain
-
 Sri Lanka
-
 Sweden
-
 Switzerland
-
 Syria
Syria
-
 Taiwan
-
 Tajikistan
-
 Tanzania
-
 Thailand
-
 Trinidad and Tobago
-
 Tunisia
-
 Turkey
-
 UAE
UAE
-
 Uganda
-
 Ukraine
-
 United Kingdom
-
United States
-
 Uruguay
-
 Uzbekistan
-
 Venezuela
-
 Vietnam
-
 Yemen
Yemen
-
 Zambia
-
 Zimbabwe
- Forex
- Crypto
