
Bearish momentum persists — Optimism slumps 7.02%

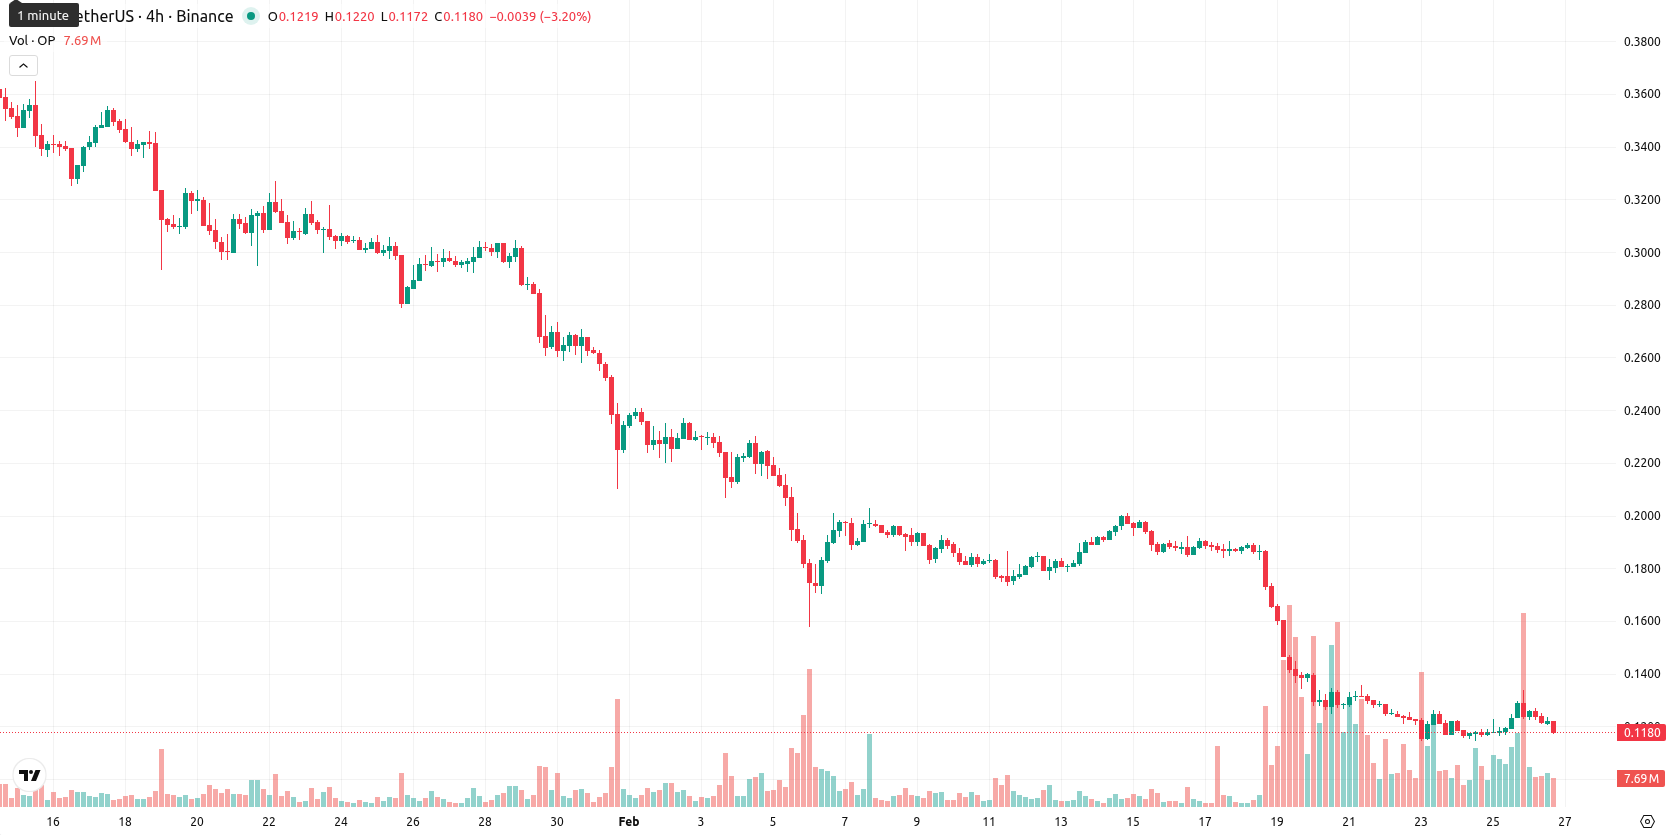
Optimism (OP) is trading at $0.1178 after a daily drop of 7.02%, positioning it well below its key moving averages. The asset remains under sustained downside pressure relative to the MA-20, MA-50, and MA-200 levels.
Highlights
- OP price trades at $0.1178, remaining well below the MA-20 ($0.1660), MA-50 ($0.2430), and MA-200 ($0.4441), signaling persistent downside momentum across all timeframes.
- Negative momentum prevails as MACD, ADX, and Bear Power reinforce the bearish trend, while both RSI and Commodity Channel Index are deep in oversold territory.
- Expected price range for the next 5 trading days is $0.1000 to $0.1300, with less than 20% probability of a price increase and risk of further declines.
Technical weakness intensifies as bearish momentum builds across indicators
The OP price is trading at $0.1178, which is well below the MA-20 ($0.1660), MA-50 ($0.2430), and MA-200 ($0.4441), indicating persistent downside momentum across the short, medium, and long term. The Ichimoku Kijun level stands at $0.1892, which sits above the current price and therefore acts as immediate resistance.
Momentum signals are negative, with both the MACD and ADX reinforcing a bearish tone, and sellers dominating intraday moves as confirmed by Bear Power readings. The RSI and Commodity Channel Index readings are deep in oversold territory, while the Stochastic RSI suggests a strong buy signal, creating a notable divergence among oscillators. The daily session opened nearly flat versus the prior close (no gap), but the price has dropped 7.02% and now trades near the session low of the $0.1203–$0.1268 range, reflecting high intraday volatility and ongoing selling pressure throughout the day.
Further declines likely as volatility persists and rebound chances fade
Looking ahead, the expected price range for the next 5 trading days is $0.1000 to $0.1300, based on recent realized volatility and the prevailing downtrend in both daily and weekly technicals. The probability of a price increase is very low (less than 20%), making further declines much more likely in the short term. Baseline scenario: OP stabilizes within this corridor as selling pressure pauses. Bullish scenario: Price rebounds above immediate resistance at $0.1892, invalidating the downtrend. Bearish scenario: Continued selling pushes price below $0.1000, extending the decline before a possible oversold bounce.
Last time, analysts noted that Optimism (OP) has rebounded sharply intraday but remains entrenched in a strong downtrend, trading well below key moving averages and facing persistent bearish pressure. Despite oversold signals on oscillators such as RSI and Stoch RSI potentially slowing the decline, momentum indicators and resistance near the Ichimoku Kijun level suggest any upside could be limited and short-lived.


Latest Optimism News


-
 Afghanistan
-
 Albania
-
 Algeria
-
 Angola
-
 Argentina
-
 Armenia
-
 Australia
-
 Austria
-
 Azerbaijan
-
 Bahamas
-
 Bahrain
-
 Bangladesh
-
 Belarus
-
 Belgium
-
 Bolivia
-
 Botswana
-
 Brazil
-
 Brunei
-
 Bulgaria
-
 Cambodia
-
 Cameroon
-
 Canada
-
 Chile
Chile
-
 China
China
-
 Colombia
-
 Congo
Congo
-
 Costa Rica
-
 Cote d'Ivoire
-
 Croatia
-
 Cuba
Cuba
-
 Cyprus
-
 Czechia
-
 DR Congo
-
 Denmark
-
 Dominican Republic
-
 Ecuador
-
 Egypt
Egypt
-
 El Salvador
-
 Estonia
-
 Eswatini
-
 Ethiopia
-
 Finland
-
 France
-
 Georgia
-
 Germany
-
 Ghana
Ghana
-
 Greece
-
 Haiti
Haiti
-
 Hong Kong
-
 Hungary
-
 India
India
-
 Indonesia
-
 Iran, Islamic republic
-
 Iraq
Iraq
-
 Ireland
-
 Israel
-
 Italy
Italy
-
 Jamaica
-
 Japan
Japan
-
 Jordan
-
 Kazakhstan
-
 Kenya
Kenya
-
 Korea
Korea
-
 Kuwait
-
 Kyrgyzstan
-
 Laos
Laos
-
 Latvia
-
 Lebanon
-
 Lesotho
-
 Libya
Libya
-
 Lithuania
-
 Luxembourg
-
 Madagascar
-
 Malaysia
-
 Malta
Malta
-
 Mauritius
-
 Mexico
-
 Moldova
-
 Mongolia
-
 Montenegro
-
 Morocco
-
 Mozambique
-
 Myanmar
-
 Namibia
-
 Nepal
Nepal
-
 Netherlands
-
 New Zealand
-
 Nigeria
-
 North Macedonia
-
 Norway
-
 Oman
Oman
-
 Pakistan
-
 Palestine
-
 Panama
-
 Papua New Guinea
-
 Paraguay
-
 Peru
Peru
-
 Philippines
-
 Poland
-
 Portugal
-
 Puerto Rico
-
 Qatar
Qatar
-
 Reunion
-
 Romania
-
 Rwanda
-
 Saudi Arabia
-
 Serbia
-
 Singapore
-
 Slovakia
-
 Slovenia
-
 Somalia
-
 South Africa
-
 Spain
Spain
-
 Sri Lanka
-
 Sweden
-
 Switzerland
-
 Syria
Syria
-
 Taiwan
-
 Tajikistan
-
 Tanzania
-
 Thailand
-
 Trinidad and Tobago
-
 Tunisia
-
 Turkey
-
 UAE
UAE
-
 Uganda
-
 Ukraine
-
 United Kingdom
-
United States
-
 Uruguay
-
 Uzbekistan
-
 Venezuela
-
 Vietnam
-
 Yemen
Yemen
-
 Zambia
-
 Zimbabwe
- Forex
- Crypto
