
DeXe: Bullish breakout and high volatility drive 7.02% jump

DeXe (DEXE) is trading at $3.54, firmly above the MA-20 ($2.48) and MA-50 ($2.79), indicating short- and medium-term bullish momentum, but well below the MA-200 ($5.43), reflecting lingering longer-term resistance. The Ichimoku Kijun level of $2.68 sits below the current price and acts as immediate support.
Highlights
- DEXE is trading at $3.54, well above the MA-20 ($2.48) and MA-50 ($2.79), indicating strong short- and medium-term bullish momentum.
- Overbought oscillators (Stochastic RSI, CCI) and a bullish MACD/ADX setup signal buyer dominance but warn of short-term exhaustion risk.
- DEXE's weekly range is expected between $3.15 and $3.90, with a bearish probability above 80% for price decline and key support at $2.68.
Overbought readings temper daily momentum as bulls dominate action
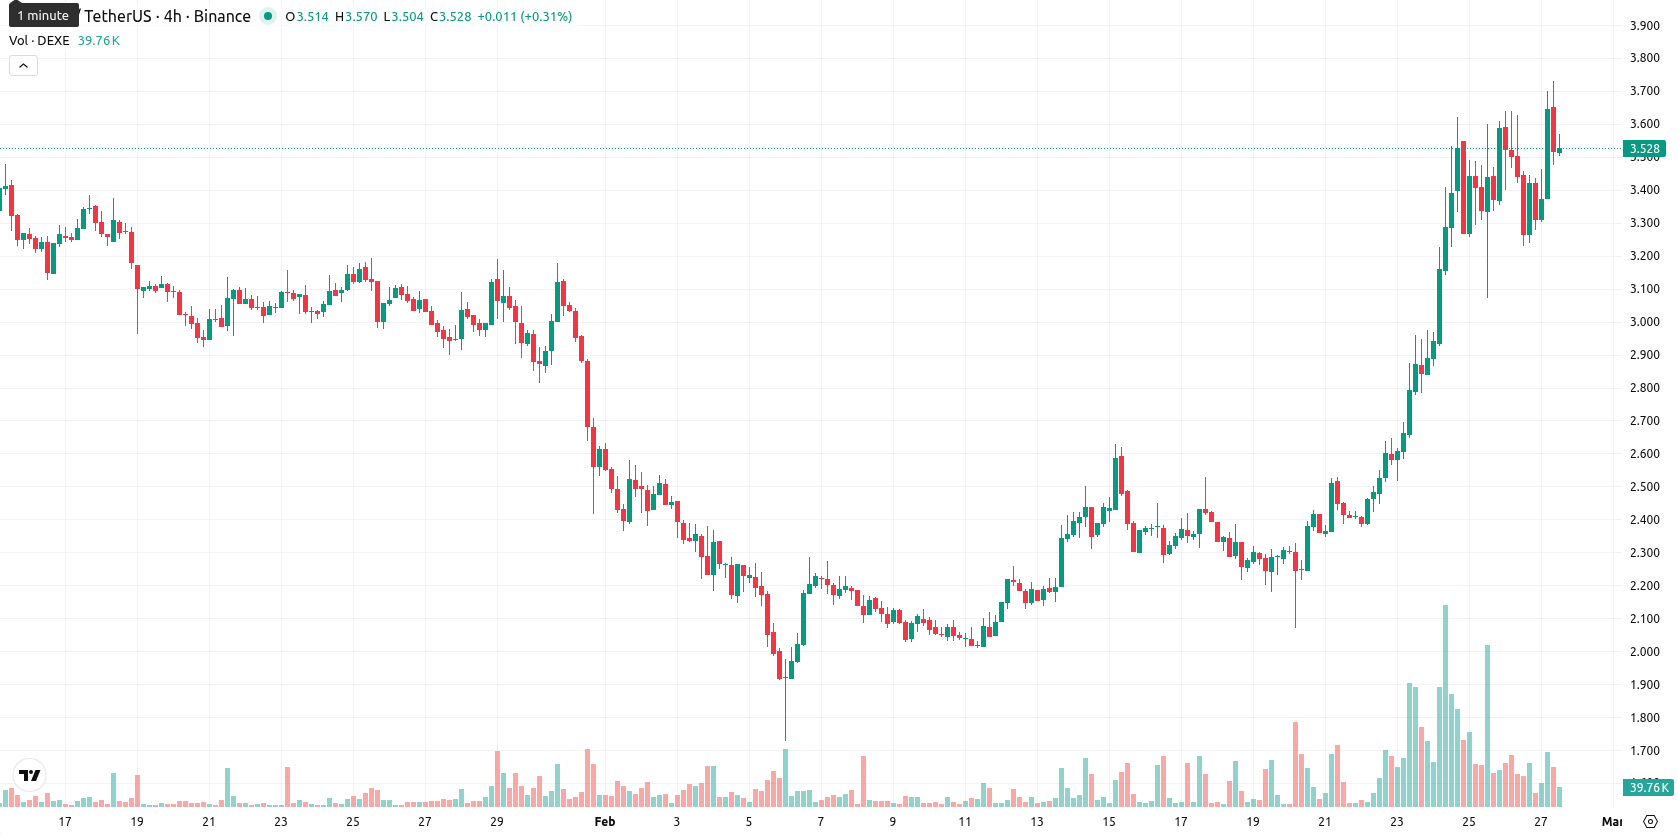
Momentum signals on the daily chart are positive, with both MACD and ADX supporting a bullish outlook, while RSI remains in "Buy" territory at 66.08. Overbought readings from the Stochastic RSI and CCI, combined with Bull/Bear Power at 0.84, signal strong buyer dominance and potential for an overextended move. The Awesome Oscillator also supports upward momentum. Price rose 7.02% today, opening nearly flat compared to the prior close (no significant gap) and now trading close to the top of today’s range ($3.3–$3.73), reflecting high volatility and strong upside pressure after the open. However, divergences between overbought oscillators and bullish momentum indicators caution that short-term exhaustion is possible even though intraday price action is aligned with bull control.
Downside risk prevails as technical signals favor consolidation
For the next week, the expected price range is $3.15 to $3.90, kept within a ±10% volatility band relative to current levels. The probability of a price increase is very low (less than 20%), with a price decline being more likely, given week-long Moving Averages, RSI, MACD, and ADX all signaling "Sell". The baseline scenario suggests consolidation between $3.15 and $3.90. A bullish breakout above $3.90 could drive a retest of higher resistance levels, while a bearish move below $3.15 may expose the asset to deeper corrections toward historical support.
Previously it was reported that DeXe is exhibiting strong short- and medium-term bullish momentum, trading above its 20- and 50-day moving averages, with immediate support at the Ichimoku Kijun, but remains below the key long-term MA-200 resistance. However, overbought conditions—indicated by elevated RSI and oscillators—alongside neutral MACD and moderate ADX, suggest rising reversal risk and a likely period of consolidation within the established volatility band as upside potential appears limited.


-
 Afghanistan
-
 Albania
-
 Algeria
-
 Angola
-
 Argentina
-
 Armenia
-
 Australia
-
 Austria
-
 Azerbaijan
-
 Bahamas
-
 Bahrain
-
 Bangladesh
-
 Belarus
-
 Belgium
-
 Bolivia
-
 Botswana
-
 Brazil
-
 Brunei
-
 Bulgaria
-
 Cambodia
-
 Cameroon
-
 Canada
-
 Chile
Chile
-
 China
China
-
 Colombia
-
 Congo
Congo
-
 Costa Rica
-
 Cote d'Ivoire
-
 Croatia
-
 Cuba
Cuba
-
 Cyprus
-
 Czechia
-
 DR Congo
-
 Denmark
-
 Dominican Republic
-
 Ecuador
-
 Egypt
Egypt
-
 El Salvador
-
 Estonia
-
 Eswatini
-
 Ethiopia
-
 Finland
-
 France
-
 Georgia
-
 Germany
-
 Ghana
Ghana
-
 Greece
-
 Haiti
Haiti
-
 Hong Kong
-
 Hungary
-
 India
India
-
 Indonesia
-
 Iran, Islamic republic
-
 Iraq
Iraq
-
 Ireland
-
 Israel
-
 Italy
Italy
-
 Jamaica
-
 Japan
Japan
-
 Jordan
-
 Kazakhstan
-
 Kenya
Kenya
-
 Korea
Korea
-
 Kuwait
-
 Kyrgyzstan
-
 Laos
Laos
-
 Latvia
-
 Lebanon
-
 Lesotho
-
 Libya
Libya
-
 Lithuania
-
 Luxembourg
-
 Madagascar
-
 Malaysia
-
 Malta
Malta
-
 Mauritius
-
 Mexico
-
 Moldova
-
 Mongolia
-
 Montenegro
-
 Morocco
-
 Mozambique
-
 Myanmar
-
 Namibia
-
 Nepal
Nepal
-
 Netherlands
-
 New Zealand
-
 Nigeria
-
 North Macedonia
-
 Norway
-
 Oman
Oman
-
 Pakistan
-
 Palestine
-
 Panama
-
 Papua New Guinea
-
 Paraguay
-
 Peru
Peru
-
 Philippines
-
 Poland
-
 Portugal
-
 Puerto Rico
-
 Qatar
Qatar
-
 Reunion
-
 Romania
-
 Rwanda
-
 Saudi Arabia
-
 Serbia
-
 Singapore
-
 Slovakia
-
 Slovenia
-
 Somalia
-
 South Africa
-
 Spain
Spain
-
 Sri Lanka
-
 Sweden
-
 Switzerland
-
 Syria
Syria
-
 Taiwan
-
 Tajikistan
-
 Tanzania
-
 Thailand
-
 Trinidad and Tobago
-
 Tunisia
-
 Turkey
-
 UAE
UAE
-
 Uganda
-
 Ukraine
-
 United Kingdom
-
United States
-
 Uruguay
-
 Uzbekistan
-
 Venezuela
-
 Vietnam
-
 Yemen
Yemen
-
 Zambia
-
 Zimbabwe
- Forex
- Crypto
