
+7.17% for Optimism — Technical indicators highlight persistent selling amid intraday bounce

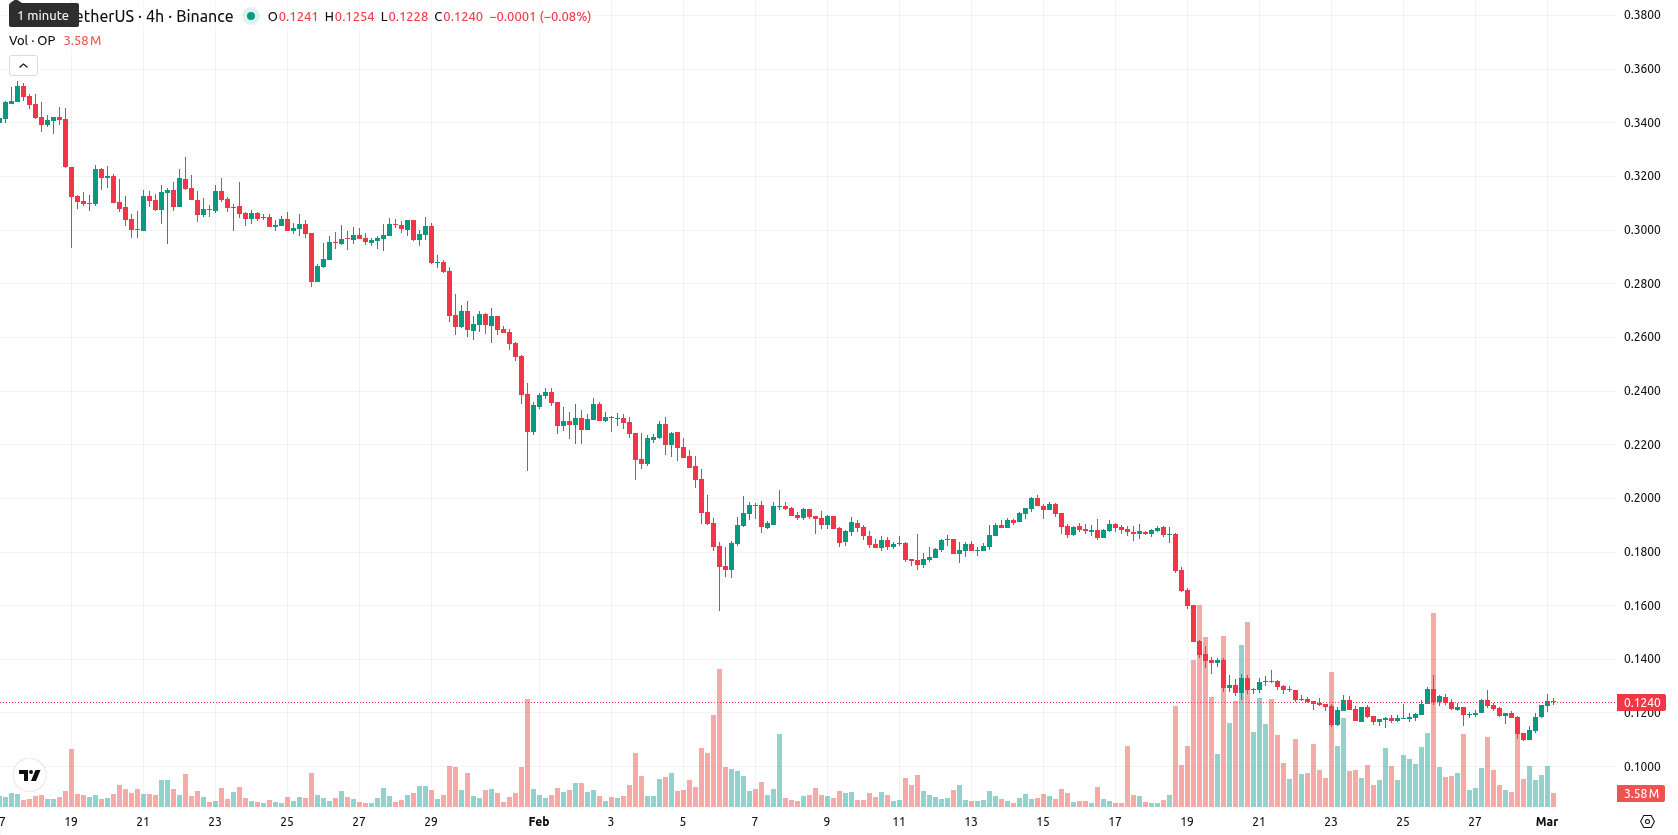
Optimism (OP) is trading at $0.124 after gaining 7.17% intraday, but remains well below the MA-20 ($0.1548), MA-50 ($0.2312), and MA-200 ($0.4343), signaling persistent downward pressure. The current price is also capped by the Ichimoku Kijun resistance at $0.1705.
Highlights
- OPTIMISM (OP) trades at $0.124, remaining below MA-20 ($0.1548), MA-50 ($0.2312), and MA-200 ($0.4343), signaling persistent bearish pressure across all timeframes.
- Momentum is strongly negative, with daily MACD and ADX confirming a high-strength downtrend and RSI and Commodity Channel Index showing OP is deeply oversold.
- The immediate resistance is $0.1705 (Ichimoku Kijun) and support near $0.115; OP is likely to consolidate between $0.112 and $0.136 next week with breakout probability below 20%.
Bearish momentum prevails as multiple indicators confirm seller control
Technically, OP faces ongoing bearish pressure with the 20-, 50-, and 200-day moving averages all above current levels and immediate resistance set by the Ichimoku Kijun at $0.1705. The price is trading in the middle of today’s range ($0.12 – $0.1269). Momentum indicators such as the daily MACD and high ADX confirm strong selling, while RSI and Commodity Channel Index readings indicate oversold conditions; intraday, the Bull/Bear Power shows continued seller dominance, while the Stochastic RSI remains neutral.
Sideways action likely amid weak breakout probabilities and soft signals
Over the coming week, OP is expected to trade within a typical volatility band of $0.112 to $0.136 unless it can break above resistance near $0.1705. The probability of a sustained upward breakout remains low due to a lack of bullish signals in key weekly technical indicators. The most likely scenario is sideways consolidation within the established range, while a move below recent support at $0.115 could open the door to further declines.
Last time, analysts noted that Optimism (OP) is trading substantially below major moving averages and remains under strong bearish momentum, as indicated by negative MACD and ADX, a deeply oversold RSI near 23, and persistent high volatility. Downside bias dominates with sellers in control, and the lack of meaningful recovery signals suggests further weakness is likely while the asset remains below key resistance levels.


Latest Optimism News


-
 Afghanistan
-
 Albania
-
 Algeria
-
 Angola
-
 Argentina
-
 Armenia
-
 Australia
-
 Austria
-
 Azerbaijan
-
 Bahamas
-
 Bahrain
-
 Bangladesh
-
 Belarus
-
 Belgium
-
 Bolivia
-
 Botswana
-
 Brazil
-
 Brunei
-
 Bulgaria
-
 Cambodia
-
 Cameroon
-
 Canada
-
 Chile
Chile
-
 China
China
-
 Colombia
-
 Congo
Congo
-
 Costa Rica
-
 Cote d'Ivoire
-
 Croatia
-
 Cuba
Cuba
-
 Cyprus
-
 Czechia
-
 DR Congo
-
 Denmark
-
 Dominican Republic
-
 Ecuador
-
 Egypt
Egypt
-
 El Salvador
-
 Estonia
-
 Eswatini
-
 Ethiopia
-
 Finland
-
 France
-
 Georgia
-
 Germany
-
 Ghana
Ghana
-
 Greece
-
 Haiti
Haiti
-
 Hong Kong
-
 Hungary
-
 India
India
-
 Indonesia
-
 Iran, Islamic republic
-
 Iraq
Iraq
-
 Ireland
-
 Israel
-
 Italy
Italy
-
 Jamaica
-
 Japan
Japan
-
 Jordan
-
 Kazakhstan
-
 Kenya
Kenya
-
 Korea
Korea
-
 Kuwait
-
 Kyrgyzstan
-
 Laos
Laos
-
 Latvia
-
 Lebanon
-
 Lesotho
-
 Libya
Libya
-
 Lithuania
-
 Luxembourg
-
 Madagascar
-
 Malaysia
-
 Malta
Malta
-
 Mauritius
-
 Mexico
-
 Moldova
-
 Mongolia
-
 Montenegro
-
 Morocco
-
 Mozambique
-
 Myanmar
-
 Namibia
-
 Nepal
Nepal
-
 Netherlands
-
 New Zealand
-
 Nigeria
-
 North Macedonia
-
 Norway
-
 Oman
Oman
-
 Pakistan
-
 Palestine
-
 Panama
-
 Papua New Guinea
-
 Paraguay
-
 Peru
Peru
-
 Philippines
-
 Poland
-
 Portugal
-
 Puerto Rico
-
 Qatar
Qatar
-
 Reunion
-
 Romania
-
 Rwanda
-
 Saudi Arabia
-
 Serbia
-
 Singapore
-
 Slovakia
-
 Slovenia
-
 Somalia
-
 South Africa
-
 Spain
Spain
-
 Sri Lanka
-
 Sweden
-
 Switzerland
-
 Syria
Syria
-
 Taiwan
-
 Tajikistan
-
 Tanzania
-
 Thailand
-
 Trinidad and Tobago
-
 Tunisia
-
 Turkey
-
 UAE
UAE
-
 Uganda
-
 Ukraine
-
 United Kingdom
-
United States
-
 Uruguay
-
 Uzbekistan
-
 Venezuela
-
 Vietnam
-
 Yemen
Yemen
-
 Zambia
-
 Zimbabwe
- Forex
- Crypto
