
Bonk rises 7.32% as buyers test resistance amid bearish momentum

Bonk (BONK) is trading at $0.0000060, below the MA-20 ($0.00000622), MA-50 ($0.00000771), and MA-200 ($0.00001336), which signals short-, medium-, and long-term pressure from sellers. The Ichimoku Kijun sits at $0.00000628, presenting immediate resistance just above the current price.
Highlights
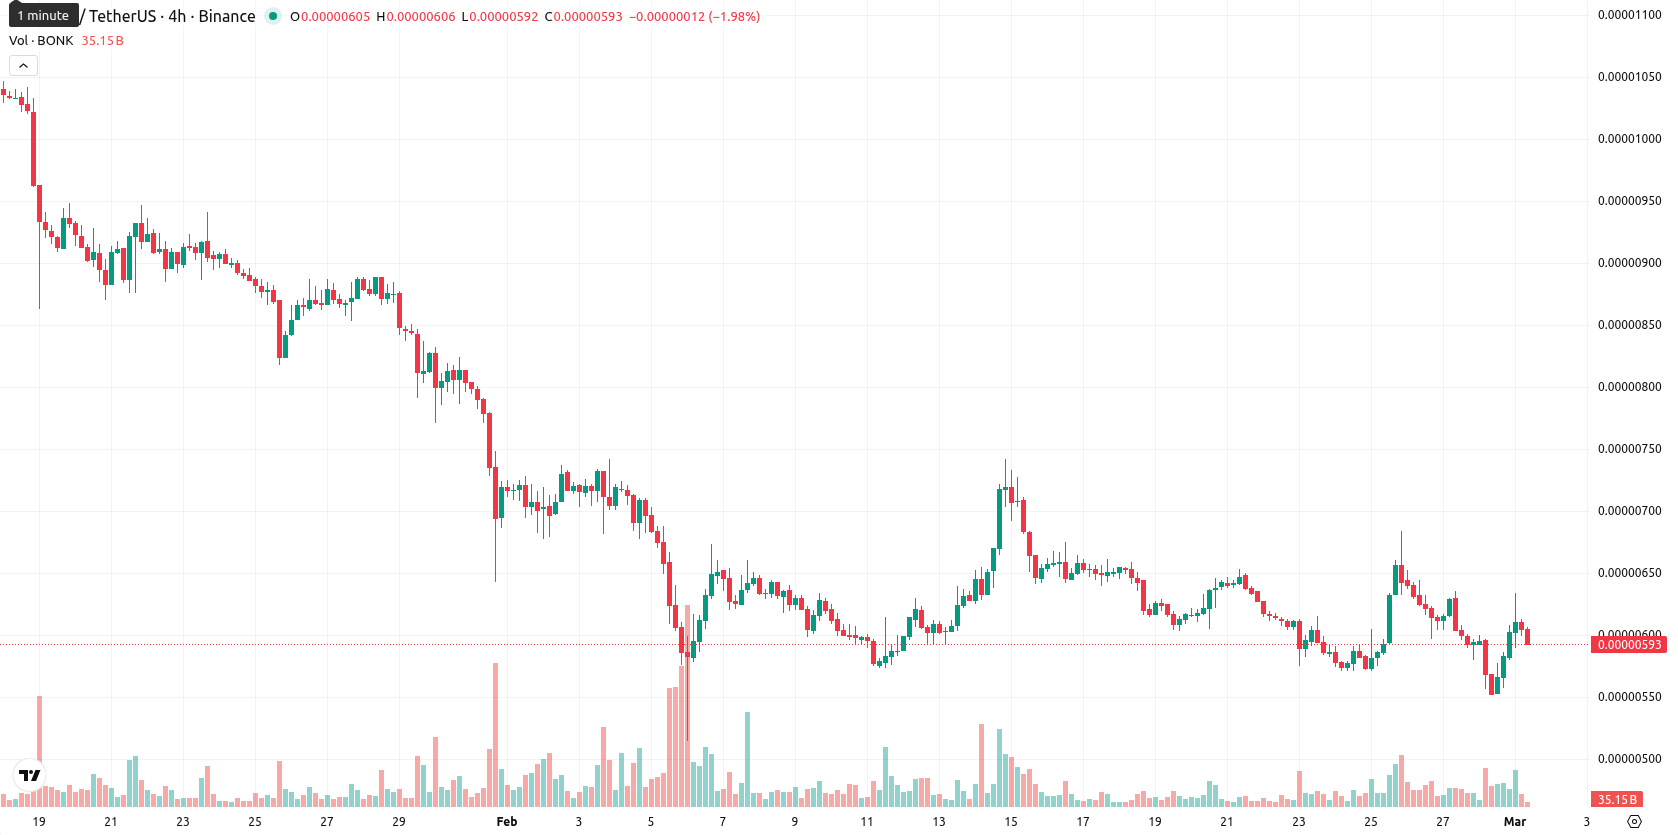
- On March 1, Bonk experienced a surge in trading volume as it breached key support levels amid a significant sell-off.
- No fundamental changes, regulatory developments, or confirmed ecosystem events for Bonk were reported during this period.
- BONK is trading at $0.0000060, below the MA-20/MA-50/MA-200, with resistance at $0.00000628 and a likely consolidation range of $0.0000054–$0.0000066.
Volume spikes amid support breach as fundamentals show no new catalysts
On March 1, Bonk saw trading volume surge significantly during a sell-off that accompanied a breach of key support levels. Technical indicators during this period reflected oversold conditions, and no fundamental changes, regulatory developments, or confirmed ecosystem events for Bonk were reported.
Divergence among oscillators offsets broad bearish momentum signals
Momentum on daily timeframes shows a strongly bearish bias, with both MACD and ADX pointing to prevailing seller strength. RSI (41.97) and CCI (–106.83) suggest the asset is approaching oversold territory, while Stochastic RSI is in neutral-to-bullish territory. Bull/Bear Power indicates sellers remain dominant, and daily price action shows a $0.0000004 (7.32%) gain with no opening gap, as today’s open matched the previous close. Price is trading near the middle of today's range ($0.0000059 — $0.0000063), volatility is moderate, and there is an initial attempt to push higher after the open. There is some divergence across oscillators, as Stochastic RSI hints at a potential reversal while wider momentum tools remain negative; this leaves today’s intraday strength partially at odds with the prevailing trend.
Sideways consolidation likely as oversold setup slows further decline
For the next 5 trading days, a typical volatility band relative to current levels is expected between $0.0000054 and $0.0000066, with sideways consolidation favored. The probability of a price increase remains very low (less than 20%), making further decline more likely. The baseline scenario sees BONK fluctuate within a narrow corridor as oversold conditions slow further losses. A bullish scenario could unfold if price breaks above the $0.00000628 resistance, hinting at short-term upward momentum, while renewed selling pressure could push the price through the support area near $0.0000054, exposing further downside risk.
Previously it was reported that Bonk is under sustained downward pressure, trading below all key moving averages, with bearish momentum confirmed by indicators such as MACD, ADX, and a low RSI. Immediate resistance remains above the current price, while volatility and downside risks persist, with limited prospects for a rebound unless momentum shifts above key resistance levels.


Latest Bonk News


-
 Afghanistan
-
 Albania
-
 Algeria
-
 Angola
-
 Argentina
-
 Armenia
-
 Australia
-
 Austria
-
 Azerbaijan
-
 Bahamas
-
 Bahrain
-
 Bangladesh
-
 Belarus
-
 Belgium
-
 Bolivia
-
 Botswana
-
 Brazil
-
 Brunei
-
 Bulgaria
-
 Cambodia
-
 Cameroon
-
 Canada
-
 Chile
Chile
-
 China
China
-
 Colombia
-
 Congo
Congo
-
 Costa Rica
-
 Cote d'Ivoire
-
 Croatia
-
 Cuba
Cuba
-
 Cyprus
-
 Czechia
-
 DR Congo
-
 Denmark
-
 Dominican Republic
-
 Ecuador
-
 Egypt
Egypt
-
 El Salvador
-
 Estonia
-
 Eswatini
-
 Ethiopia
-
 Finland
-
 France
-
 Georgia
-
 Germany
-
 Ghana
Ghana
-
 Greece
-
 Haiti
Haiti
-
 Hong Kong
-
 Hungary
-
 India
India
-
 Indonesia
-
 Iran, Islamic republic
-
 Iraq
Iraq
-
 Ireland
-
 Israel
-
 Italy
Italy
-
 Jamaica
-
 Japan
Japan
-
 Jordan
-
 Kazakhstan
-
 Kenya
Kenya
-
 Korea
Korea
-
 Kuwait
-
 Kyrgyzstan
-
 Laos
Laos
-
 Latvia
-
 Lebanon
-
 Lesotho
-
 Libya
Libya
-
 Lithuania
-
 Luxembourg
-
 Madagascar
-
 Malaysia
-
 Malta
Malta
-
 Mauritius
-
 Mexico
-
 Moldova
-
 Mongolia
-
 Montenegro
-
 Morocco
-
 Mozambique
-
 Myanmar
-
 Namibia
-
 Nepal
Nepal
-
 Netherlands
-
 New Zealand
-
 Nigeria
-
 North Macedonia
-
 Norway
-
 Oman
Oman
-
 Pakistan
-
 Palestine
-
 Panama
-
 Papua New Guinea
-
 Paraguay
-
 Peru
Peru
-
 Philippines
-
 Poland
-
 Portugal
-
 Puerto Rico
-
 Qatar
Qatar
-
 Reunion
-
 Romania
-
 Rwanda
-
 Saudi Arabia
-
 Serbia
-
 Singapore
-
 Slovakia
-
 Slovenia
-
 Somalia
-
 South Africa
-
 Spain
Spain
-
 Sri Lanka
-
 Sweden
-
 Switzerland
-
 Syria
Syria
-
 Taiwan
-
 Tajikistan
-
 Tanzania
-
 Thailand
-
 Trinidad and Tobago
-
 Tunisia
-
 Turkey
-
 UAE
UAE
-
 Uganda
-
 Ukraine
-
 United Kingdom
-
United States
-
 Uruguay
-
 Uzbekistan
-
 Venezuela
-
 Vietnam
-
 Yemen
Yemen
-
 Zambia
-
 Zimbabwe
- Forex
- Crypto
