
Flow dips as momentum indicators confirm extended downside pressure

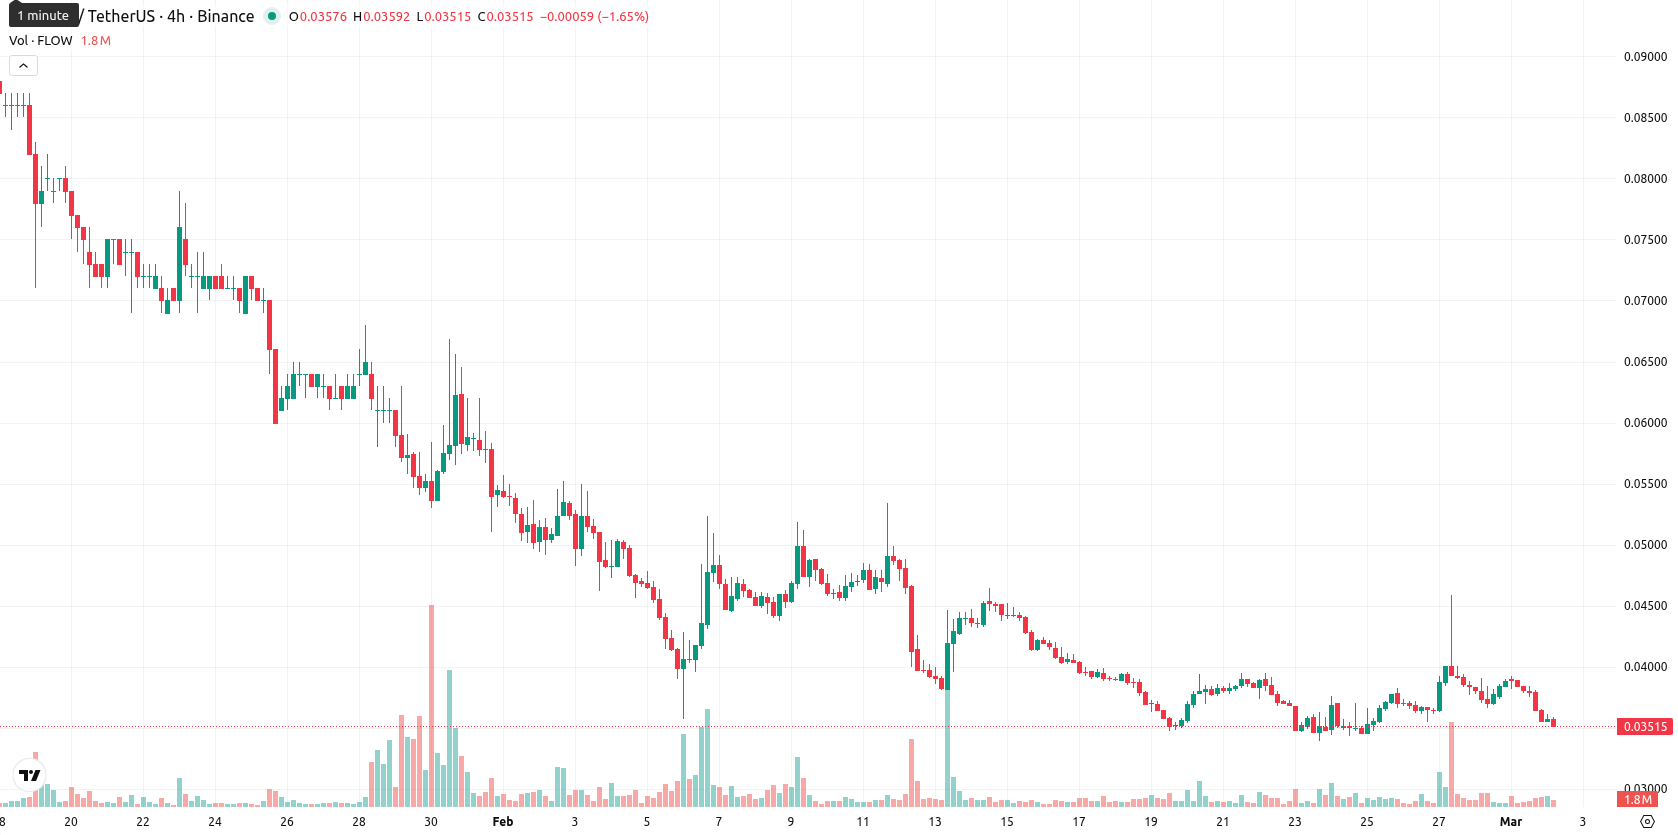
Flow (FLOW) is trading at $0.0353, reflecting a daily drop of 8.31%. The current price remains below the MA-20 ($0.0394), MA-50 ($0.0552), and MA-200 ($0.2251), confirming strong bearish pressure across all timeframes.
Highlights
- FLOW trades at $0.0353, well below MA-20 ($0.0394), MA-50 ($0.0552), and MA-200 ($0.2251), signaling persistent bearish pressure across all timeframes.
- Negative momentum dominates with MACD, ADX, RSI, and Stochastic RSI all confirming strong downtrend conditions and limited buyer interest despite intraday volatility.
- Key support is at $0.0320 and resistance at $0.0380; a sustained move below $0.0320 could trigger further declines, with less than 20% probability of a sustained recovery.
Bearish technical signals as momentum indicators align lower
The Ichimoku Kijun level sits at $0.0430, immediately above the last traded price and acting as resistance. Momentum indicators, including MACD and ADX, confirm a pronounced downtrend. RSI and Commodity Channel Index remain bearish but are not at oversold levels, while Stochastic RSI highlights ongoing selling pressure without entering extreme territory. Bull/Bear Power signals continued seller dominance intraday, and the Awesome Oscillator is neutral, giving no reversal support. Intraday price action has stayed volatile and pressured to the downside, with all short-term signals aligned with the current move lower.
Limited recovery chances as volatility persists within narrow band
Over the next five trading days, FLOW is expected to trade within a volatility band of $0.0320 to $0.0380 relative to current levels. The likelihood of a sustained rebound remains low, with less than a 20% probability of an extended rise. The baseline outlook is for sideways movement between $0.0320 and $0.0380. A bullish breakout would require a decisive move above $0.0380 and the Ichimoku Kijun, while a break below $0.0320 could accelerate downside momentum; both daily and weekly indicators continue to highlight a bearish bias with limited recovery potential in the near term.
Previously it was reported that FLOW remains under strong bearish pressure, trading well below major moving averages with price action constrained by persistent selling and technical resistance at the Ichimoku Kijun. Key momentum indicators—MACD, ADX, and RSI—signal dominant downside risk, suggesting only limited upside potential as the asset is likely to continue oscillating within a narrow range unless a decisive break above near-term resistance occurs.


-
 Afghanistan
-
 Albania
-
 Algeria
-
 Angola
-
 Argentina
-
 Armenia
-
 Australia
-
 Austria
-
 Azerbaijan
-
 Bahamas
-
 Bahrain
-
 Bangladesh
-
 Belarus
-
 Belgium
-
 Bolivia
-
 Botswana
-
 Brazil
-
 Brunei
-
 Bulgaria
-
 Cambodia
-
 Cameroon
-
 Canada
-
 Chile
Chile
-
 China
China
-
 Colombia
-
 Congo
Congo
-
 Costa Rica
-
 Cote d'Ivoire
-
 Croatia
-
 Cuba
Cuba
-
 Cyprus
-
 Czechia
-
 DR Congo
-
 Denmark
-
 Dominican Republic
-
 Ecuador
-
 Egypt
Egypt
-
 El Salvador
-
 Estonia
-
 Eswatini
-
 Ethiopia
-
 Finland
-
 France
-
 Georgia
-
 Germany
-
 Ghana
Ghana
-
 Greece
-
 Haiti
Haiti
-
 Hong Kong
-
 Hungary
-
 India
India
-
 Indonesia
-
 Iran, Islamic republic
-
 Iraq
Iraq
-
 Ireland
-
 Israel
-
 Italy
Italy
-
 Jamaica
-
 Japan
Japan
-
 Jordan
-
 Kazakhstan
-
 Kenya
Kenya
-
 Korea
Korea
-
 Kuwait
-
 Kyrgyzstan
-
 Laos
Laos
-
 Latvia
-
 Lebanon
-
 Lesotho
-
 Libya
Libya
-
 Lithuania
-
 Luxembourg
-
 Madagascar
-
 Malaysia
-
 Malta
Malta
-
 Mauritius
-
 Mexico
-
 Moldova
-
 Mongolia
-
 Montenegro
-
 Morocco
-
 Mozambique
-
 Myanmar
-
 Namibia
-
 Nepal
Nepal
-
 Netherlands
-
 New Zealand
-
 Nigeria
-
 North Macedonia
-
 Norway
-
 Oman
Oman
-
 Pakistan
-
 Palestine
-
 Panama
-
 Papua New Guinea
-
 Paraguay
-
 Peru
Peru
-
 Philippines
-
 Poland
-
 Portugal
-
 Puerto Rico
-
 Qatar
Qatar
-
 Reunion
-
 Romania
-
 Rwanda
-
 Saudi Arabia
-
 Serbia
-
 Singapore
-
 Slovakia
-
 Slovenia
-
 Somalia
-
 South Africa
-
 Spain
Spain
-
 Sri Lanka
-
 Sweden
-
 Switzerland
-
 Syria
Syria
-
 Taiwan
-
 Tajikistan
-
 Tanzania
-
 Thailand
-
 Trinidad and Tobago
-
 Tunisia
-
 Turkey
-
 UAE
UAE
-
 Uganda
-
 Ukraine
-
 United Kingdom
-
United States
-
 Uruguay
-
 Uzbekistan
-
 Venezuela
-
 Vietnam
-
 Yemen
Yemen
-
 Zambia
-
 Zimbabwe
- Forex
- Crypto
