
Solana price prediction: Will institutional support help SOL resist further downside?

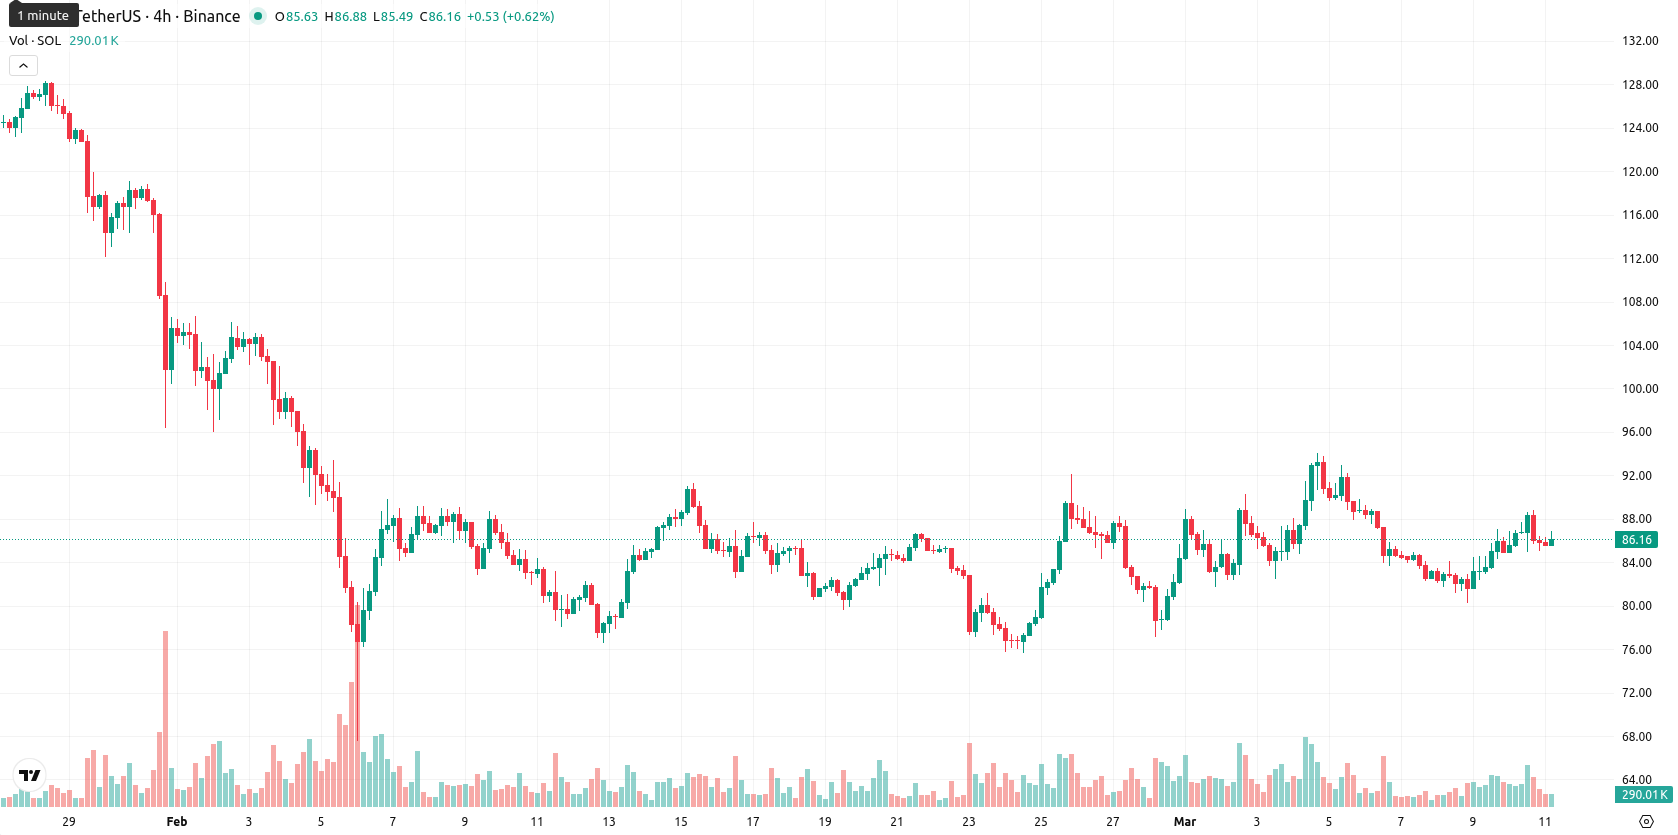
Solana (SOL) is trading at $86.10, above the SMA-20 ($84.45) but below the SMA-50 ($94.78) and far beneath the SMA-200 ($152.31). This suggests positive short-term momentum, but signals continued medium- and long-term pressure from sellers. The Ichimoku Kijun level at $84.84 stands as immediate support just below the current price.
Highlights
- Institutional interest in Solana ETFs surged, with 30 major holders and $1 billion in inflows representing 2% of SOL's market cap.
- Despite robust on-chain application revenue topping $2.3 billion in 2025, Solana price remains under persistent selling pressure.
- SOL trades in a constrained $80–$95 range as short-term buyer activity offsets dominant medium-term bearish momentum, with a downside bias prevailing.
Institutional flows offset selling as ETF adoption rises
Institutional participation in Solana ETFs increased as recent filings listed around 30 major institutions holding approximately $540 million in ETF positions. U.S. spot Solana ETFs accumulated nearly $1 billion in inflows, representing about 2% of SOL’s market capitalization and primarily drawing crypto-native institutional capital. The derivatives market saw major leveraged long positions liquidated after key downside levels were breached, and SolanaFloor resumed operations under the Jito Foundation following a treasury breach earlier in the year. On-chain data showed Solana’s application layer generated over $2.3 billion in total revenue in 2025, though price action has remained under broader selling pressure.
Mixed momentum as bearish signals clash with intraday buying
Momentum signals remain mixed: D1 MACD shows strong bearish momentum, and ADX at 32.85 indicates a prevailing trend, but both RSI (46.94) and Stoch RSI suggest soft downside bias without clear oversold signals. CCI (56.22) is slightly bullish, while BBP is firmly overbought (3.70), pointing to buyer dominance intraday despite an overall negative daily move. The day opened with no notable gap from the previous close, and price is currently mid-range for the session ($85.49 — $86.86) after a mild decline of 0.37%. Intraday volatility is low and the tone has been sideways, with buyer momentum contrasting short-term bearish signals from MACD and several oscillators — highlighting notable divergence.
Downside bias persists as volatility bands constrain moves
For the next five sessions, the expected range is $80.00 to $95.00, calibrated to stay within a typical volatility band relative to current levels. The probability of an upward move is very low (less than 20%), making a further decline more likely. The baseline scenario envisions consolidation between $80 and $95 as short-term and medium-term pressure balance out. In a bullish case, price may attempt to break above $95, overcoming current resistance, while a bearish scenario could see a drop below the $84 support toward $80 if selling pressure intensifies.
Last time, analysts noted that Solana is showing short-term resilience above its 20-day moving average, but overall technicals—including negative MACD, bearish ADX, and moderate RSI—reflect continued medium- and long-term downside pressure amid regulatory and geopolitical headwinds. Immediate support holds near the Ichimoku Kijun level, with current price action expected to remain range-bound within defined support and resistance as seller dominance persists and the likelihood of a sustained rally remains low.


Latest Solana News


-
 Afghanistan
-
 Albania
-
 Algeria
-
 Angola
-
 Argentina
-
 Armenia
-
 Australia
-
 Austria
-
 Azerbaijan
-
 Bahamas
-
 Bahrain
-
 Bangladesh
-
 Belarus
-
 Belgium
-
 Bolivia
-
 Botswana
-
 Brazil
-
 Brunei
-
 Bulgaria
-
 Cambodia
-
 Cameroon
-
 Canada
-
 Chile
Chile
-
 China
China
-
 Colombia
-
 Congo
Congo
-
 Costa Rica
-
 Cote d'Ivoire
-
 Croatia
-
 Cuba
Cuba
-
 Cyprus
-
 Czechia
-
 DR Congo
-
 Denmark
-
 Dominican Republic
-
 Ecuador
-
 Egypt
Egypt
-
 El Salvador
-
 Estonia
-
 Eswatini
-
 Ethiopia
-
 Finland
-
 France
-
 Georgia
-
 Germany
-
 Ghana
Ghana
-
 Greece
-
 Haiti
Haiti
-
 Hong Kong
-
 Hungary
-
 India
India
-
 Indonesia
-
 Iran, Islamic republic
-
 Iraq
Iraq
-
 Ireland
-
 Israel
-
 Italy
Italy
-
 Jamaica
-
 Japan
Japan
-
 Jordan
-
 Kazakhstan
-
 Kenya
Kenya
-
 Korea
Korea
-
 Kuwait
-
 Kyrgyzstan
-
 Laos
Laos
-
 Latvia
-
 Lebanon
-
 Lesotho
-
 Libya
Libya
-
 Lithuania
-
 Luxembourg
-
 Madagascar
-
 Malaysia
-
 Malta
Malta
-
 Mauritius
-
 Mexico
-
 Moldova
-
 Mongolia
-
 Montenegro
-
 Morocco
-
 Mozambique
-
 Myanmar
-
 Namibia
-
 Nepal
Nepal
-
 Netherlands
-
 New Zealand
-
 Nigeria
-
 North Macedonia
-
 Norway
-
 Oman
Oman
-
 Pakistan
-
 Palestine
-
 Panama
-
 Papua New Guinea
-
 Paraguay
-
 Peru
Peru
-
 Philippines
-
 Poland
-
 Portugal
-
 Puerto Rico
-
 Qatar
Qatar
-
 Reunion
-
 Romania
-
 Rwanda
-
 Saudi Arabia
-
 Serbia
-
 Singapore
-
 Slovakia
-
 Slovenia
-
 Somalia
-
 South Africa
-
 Spain
Spain
-
 Sri Lanka
-
 Sweden
-
 Switzerland
-
 Syria
Syria
-
 Taiwan
-
 Tajikistan
-
 Tanzania
-
 Thailand
-
 Trinidad and Tobago
-
 Tunisia
-
 Turkey
-
 UAE
UAE
-
 Uganda
-
 Ukraine
-
 United Kingdom
-
United States
-
 Uruguay
-
 Uzbekistan
-
 Venezuela
-
 Vietnam
-
 Yemen
Yemen
-
 Zambia
-
 Zimbabwe
- Forex
- Crypto
