
Ethereum price prediction: Can new network records lift ETH as resistance looms?

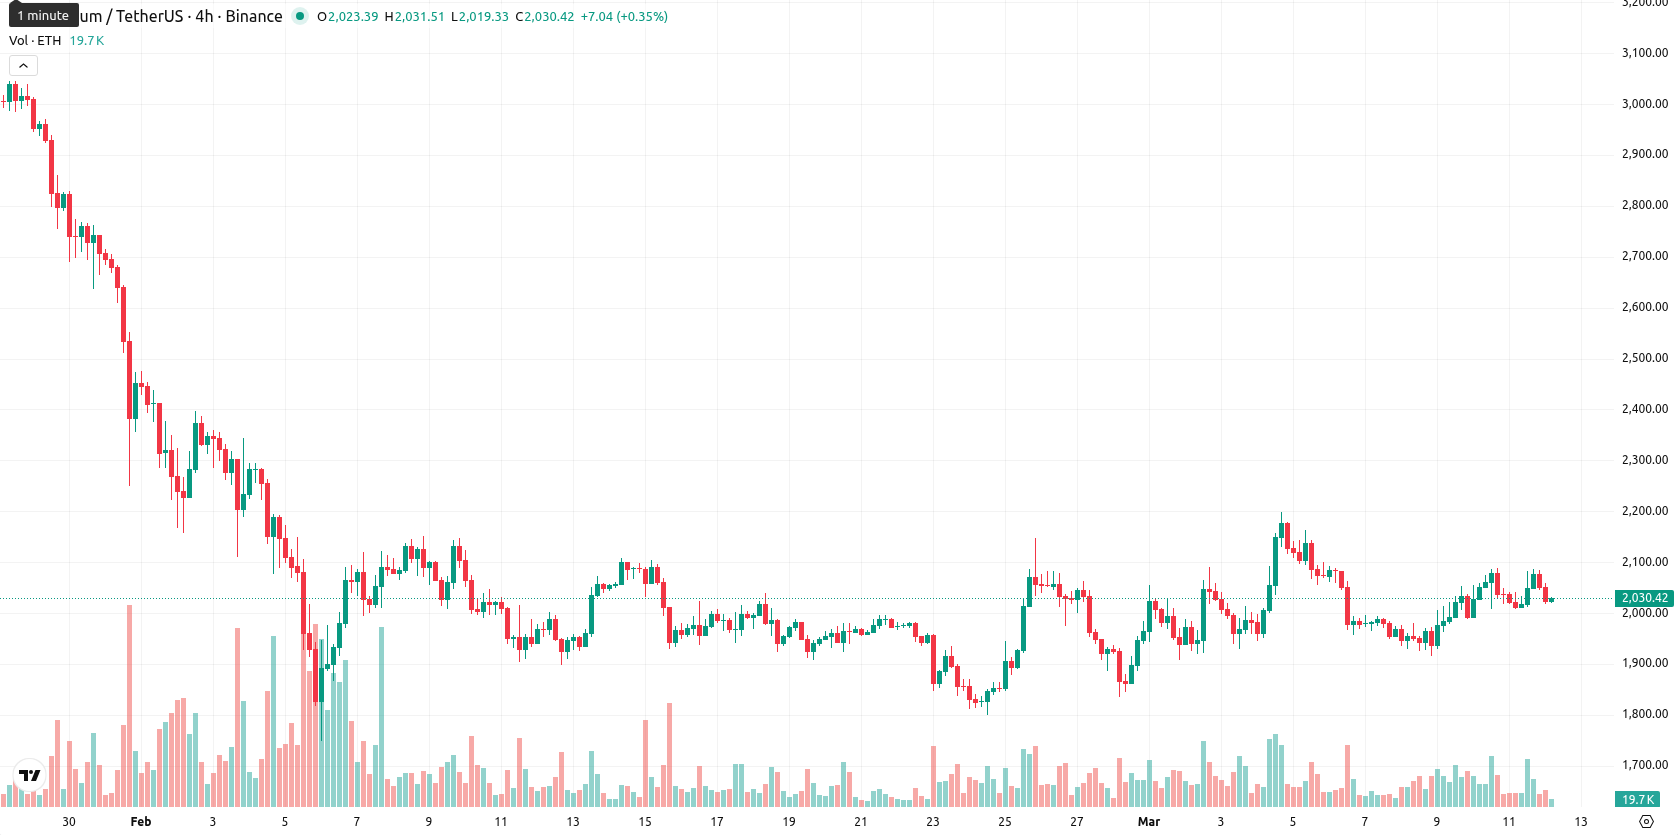
Ethereum (ETH) is trading at $2,028.60, up 0.50% for the day and currently positioned above the SMA-20 ($1,985.55), but remains below both the SMA-50 ($2,208.04) and the SMA-200 ($3,285.77). This placement signals some near-term buoyancy, while medium- and long-term technical trends point to sustained bearish pressure.
Highlights
- 21Shares Ethereum ETF (TETH) saw over $1 million in inflows, adding more than 5% to its AUM amid record network activity.
- Ethereum adoption accelerated, with active addresses and non-empty wallets reaching all-time highs despite falling transaction fee revenue from layer-2 competition.
- ETH faces bearish medium- and long-term technical signals, with expected trading between $1,850 and $2,200 and a low probability of near-term upside.
Strong ETF inflows and user adoption amid softened revenue and whale activity
On March 11, 2026, the 21Shares Ethereum ETF (TETH) recorded a major inflow of over $1 million, contributing more than 5% of its assets under management. Concurrently, Ethereum network activity reached all-time highs, with a surge in active addresses and smart contract calls, while the number of non-empty wallets surpassed 182 million, indicating expanding user adoption. Transaction fee revenues decreased due to increased competition from layer-2 networks and capital outflows, while whale activity with large exchange withdrawals and heightened institutional interest also influenced sentiment.
Mixed technical signals as overbought oscillators diverge from bearish momentum
ETH is showing moderate short-term strength with price above the SMA-20 and the Ichimoku Kijun ($1,999.50) offering immediate support, but it stays below the SMA-50 and SMA-200, which reinforces the prevailing bearish structure in the medium and long term. Key technical signals reflect mostly bearish momentum — MACD remains at strong sell on both daily and weekly intervals, and ADX signals a sell on D1 while neutral on W1. The RSI hovers neutral near 50 for D1, Stoch RSI and Bull/Bear Power (BBP) are both in overbought conditions with buyers dominating intraday action, and CCI registers a buy, but the Awesome Oscillator is flat and there is evident divergence between overbought oscillators and bearish momentum indicators. ETH is trading in the middle of today’s $2,018.21 – $2,057.64 range, with muted conviction and low volatility following a minor gap up at the open.
Further weakness favored as combined weekly indicators cap upside risk
In the short term, ETH is likely to move within a typical volatility band of $1,850 to $2,200 over the next five trading days, aligning with recent weekly price action. Combined sell signals from RSI-W1, ADX-W1, MACD-W1, and MA-50-W1 indicate a less than 20% probability of a significant upside move, suggesting a greater likelihood of further weakness or sideways trading between established support and resistance. A clear break above $2,200 would be required to open up a more substantial recovery scenario, while a drop below $1,850 could trigger additional declines if bearish momentum resumes.
Previously it was reported that Ethereum is trading above its short-term moving average but remains pressured below both its medium- and long-term moving averages, reflecting a short-term bullish bias amid broader downside risks from geopolitical and regulatory uncertainties. Technical indicators show mixed momentum, with oscillators signaling overbought conditions but trend indicators and the MACD remaining bearish, suggesting limited upside and a higher probability of consolidation or further decline within established support and resistance levels.


Latest Ethereum News


-
 Afghanistan
-
 Albania
-
 Algeria
-
 Angola
-
 Argentina
-
 Armenia
-
 Australia
-
 Austria
-
 Azerbaijan
-
 Bahamas
-
 Bahrain
-
 Bangladesh
-
 Belarus
-
 Belgium
-
 Bolivia
-
 Botswana
-
 Brazil
-
 Brunei
-
 Bulgaria
-
 Cambodia
-
 Cameroon
-
 Canada
-
 Chile
Chile
-
 China
China
-
 Colombia
-
 Congo
Congo
-
 Costa Rica
-
 Cote d'Ivoire
-
 Croatia
-
 Cuba
Cuba
-
 Cyprus
-
 Czechia
-
 DR Congo
-
 Denmark
-
 Dominican Republic
-
 Ecuador
-
 Egypt
Egypt
-
 El Salvador
-
 Estonia
-
 Eswatini
-
 Ethiopia
-
 Finland
-
 France
-
 Georgia
-
 Germany
-
 Ghana
Ghana
-
 Greece
-
 Haiti
Haiti
-
 Hong Kong
-
 Hungary
-
 India
India
-
 Indonesia
-
 Iran, Islamic republic
-
 Iraq
Iraq
-
 Ireland
-
 Israel
-
 Italy
Italy
-
 Jamaica
-
 Japan
Japan
-
 Jordan
-
 Kazakhstan
-
 Kenya
Kenya
-
 Korea
Korea
-
 Kuwait
-
 Kyrgyzstan
-
 Laos
Laos
-
 Latvia
-
 Lebanon
-
 Lesotho
-
 Libya
Libya
-
 Lithuania
-
 Luxembourg
-
 Madagascar
-
 Malaysia
-
 Malta
Malta
-
 Mauritius
-
 Mexico
-
 Moldova
-
 Mongolia
-
 Montenegro
-
 Morocco
-
 Mozambique
-
 Myanmar
-
 Namibia
-
 Nepal
Nepal
-
 Netherlands
-
 New Zealand
-
 Nigeria
-
 North Macedonia
-
 Norway
-
 Oman
Oman
-
 Pakistan
-
 Palestine
-
 Panama
-
 Papua New Guinea
-
 Paraguay
-
 Peru
Peru
-
 Philippines
-
 Poland
-
 Portugal
-
 Puerto Rico
-
 Qatar
Qatar
-
 Reunion
-
 Romania
-
 Rwanda
-
 Saudi Arabia
-
 Serbia
-
 Singapore
-
 Slovakia
-
 Slovenia
-
 Somalia
-
 South Africa
-
 Spain
Spain
-
 Sri Lanka
-
 Sweden
-
 Switzerland
-
 Syria
Syria
-
 Taiwan
-
 Tajikistan
-
 Tanzania
-
 Thailand
-
 Trinidad and Tobago
-
 Tunisia
-
 Turkey
-
 UAE
UAE
-
 Uganda
-
 Ukraine
-
 United Kingdom
-
United States
-
 Uruguay
-
 Uzbekistan
-
 Venezuela
-
 Vietnam
-
 Yemen
Yemen
-
 Zambia
-
 Zimbabwe
- Forex
- Crypto
