
Optimism: Diverging momentum indicators drive a 7.23% rise amid consolidation risks

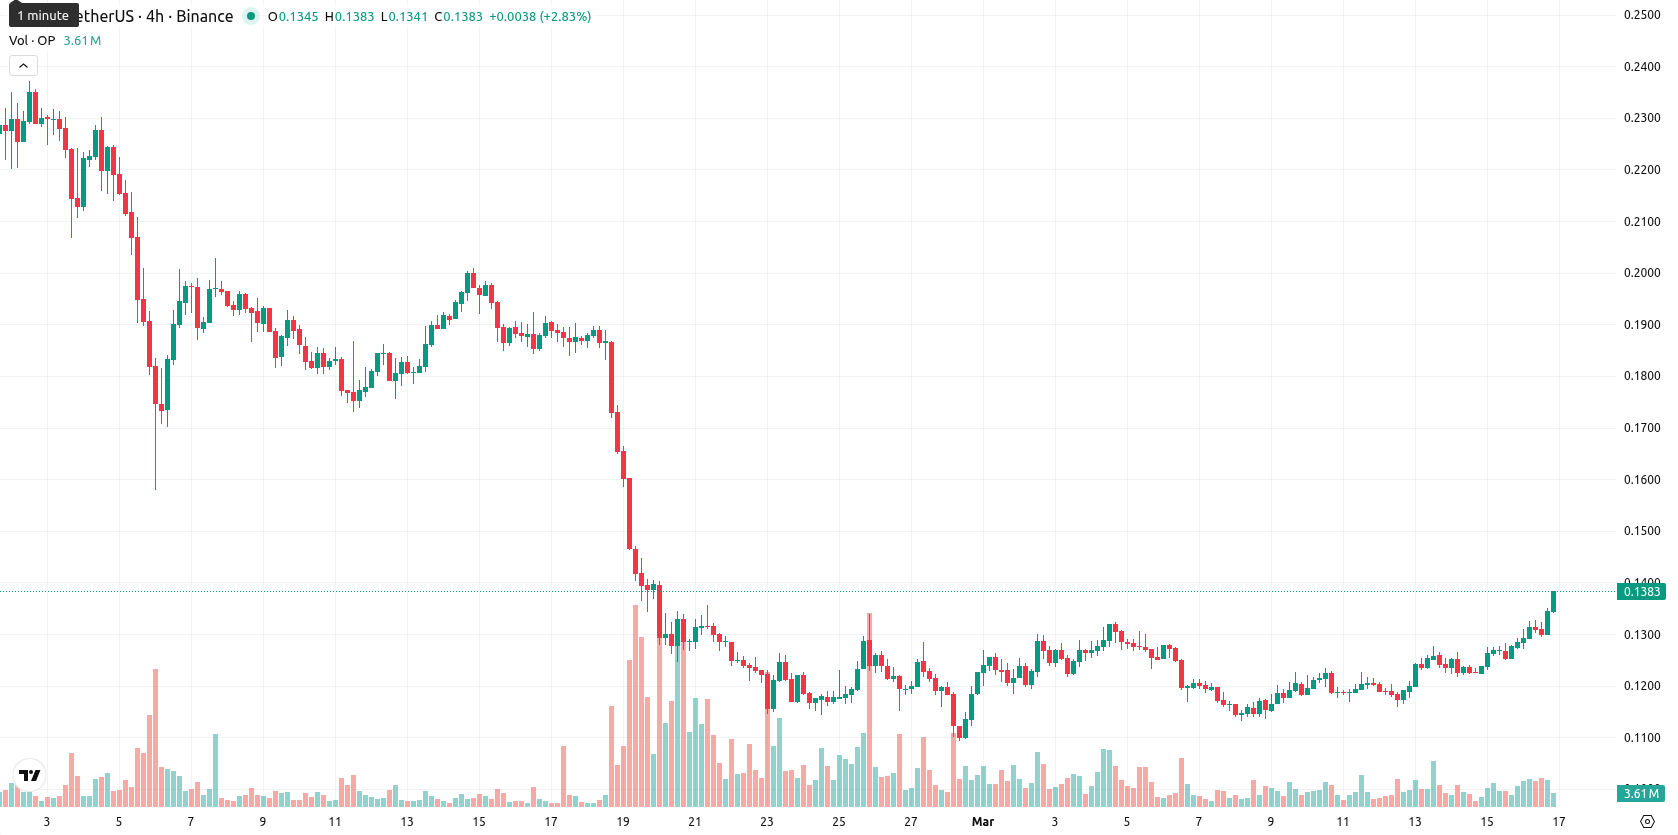
Optimism (OP) is trading at $0.138, up 7.23% on the day. The asset stands above its 20-day simple moving average ($0.1217), but remains below the 50-day ($0.1708) and 200-day ($0.3876) moving averages.
Highlights
- OP shows short-term recovery by trading above its 20-day moving average, but remains in a broader bearish trend.
- Momentum and oscillator signals are mixed, with intraday buying pressure and overbought indicators diverging from ongoing daily bearish momentum.
- Price is expected to consolidate between $0.124 and $0.148 in the coming sessions, with downside risk prevailing over bullish breakouts.
Mixed momentum signals as resistance holds amid recovery attempt
Technically, OP's position above the SMA-20 but below the SMA-50 and SMA-200 indicates short-term recovery potential within a medium- to long-term bearish trend. The Ichimoku Kijun level at $0.1494 sits above the current price and serves as immediate resistance. MACD and ADX on the daily chart both highlight enduring bearish momentum, though Bull/Bear Power (BBP) reveals strong intraday buying pressure and the Awesome Oscillator is neutral. The RSI stands at 40, not signaling oversold conditions, while the Stoch RSI and CCI indicate overbought readings — a clear divergence in short-term momentum indicators.
Downside risk dominates as consolidation likely to persist
Over the next five sessions, OP is expected to fluctuate between $0.124 and $0.148, a typical volatility band relative to current levels. The probability of a sustained move higher is low (less than 20%), with further downside more likely. The baseline scenario is consolidation within this range. A bullish breakout above $0.1494 could lead to gains above $0.148, while renewed selling below $0.124 would expose further downside risk.
Earlier, analysts noted that Optimism was mired in a medium- to long-term bearish trend, with short-term volatility failing to produce a sustainable reversal. The latest developments reaffirm this cautious outlook, with momentum oscillators presenting mixed signals and the key resistance at $0.1494 serving as a critical level to watch for any potential shift in direction.


Latest Optimism News


-
 Afghanistan
-
 Albania
-
 Algeria
-
 Angola
-
 Argentina
-
 Armenia
-
 Australia
-
 Austria
-
 Azerbaijan
-
 Bahamas
-
 Bahrain
-
 Bangladesh
-
 Belarus
-
 Belgium
-
 Bolivia
-
 Botswana
-
 Brazil
-
 Brunei
-
 Bulgaria
-
 Cambodia
-
 Cameroon
-
 Canada
-
 Chile
Chile
-
 China
China
-
 Colombia
-
 Congo
Congo
-
 Costa Rica
-
 Cote d'Ivoire
-
 Croatia
-
 Cuba
Cuba
-
 Cyprus
-
 Czechia
-
 DR Congo
-
 Denmark
-
 Dominican Republic
-
 Ecuador
-
 Egypt
Egypt
-
 El Salvador
-
 Estonia
-
 Eswatini
-
 Ethiopia
-
 Finland
-
 France
-
 Georgia
-
 Germany
-
 Ghana
Ghana
-
 Greece
-
 Haiti
Haiti
-
 Hong Kong
-
 Hungary
-
 India
India
-
 Indonesia
-
 Iran, Islamic republic
-
 Iraq
Iraq
-
 Ireland
-
 Israel
-
 Italy
Italy
-
 Jamaica
-
 Japan
Japan
-
 Jordan
-
 Kazakhstan
-
 Kenya
Kenya
-
 Korea
Korea
-
 Kuwait
-
 Kyrgyzstan
-
 Laos
Laos
-
 Latvia
-
 Lebanon
-
 Lesotho
-
 Libya
Libya
-
 Lithuania
-
 Luxembourg
-
 Madagascar
-
 Malaysia
-
 Malta
Malta
-
 Mauritius
-
 Mexico
-
 Moldova
-
 Mongolia
-
 Montenegro
-
 Morocco
-
 Mozambique
-
 Myanmar
-
 Namibia
-
 Nepal
Nepal
-
 Netherlands
-
 New Zealand
-
 Nigeria
-
 North Macedonia
-
 Norway
-
 Oman
Oman
-
 Pakistan
-
 Palestine
-
 Panama
-
 Papua New Guinea
-
 Paraguay
-
 Peru
Peru
-
 Philippines
-
 Poland
-
 Portugal
-
 Puerto Rico
-
 Qatar
Qatar
-
 Reunion
-
 Romania
-
 Rwanda
-
 Saudi Arabia
-
 Serbia
-
 Singapore
-
 Slovakia
-
 Slovenia
-
 Somalia
-
 South Africa
-
 Spain
Spain
-
 Sri Lanka
-
 Sweden
-
 Switzerland
-
 Syria
Syria
-
 Taiwan
-
 Tajikistan
-
 Tanzania
-
 Thailand
-
 Trinidad and Tobago
-
 Tunisia
-
 Turkey
-
 UAE
UAE
-
 Uganda
-
 Ukraine
-
 United Kingdom
-
United States
-
 Uruguay
-
 Uzbekistan
-
 Venezuela
-
 Vietnam
-
 Yemen
Yemen
-
 Zambia
-
 Zimbabwe
- Forex
- Crypto
