
-7.37% for Immutable X — Uncertainty persists after daily losses and momentum divergence

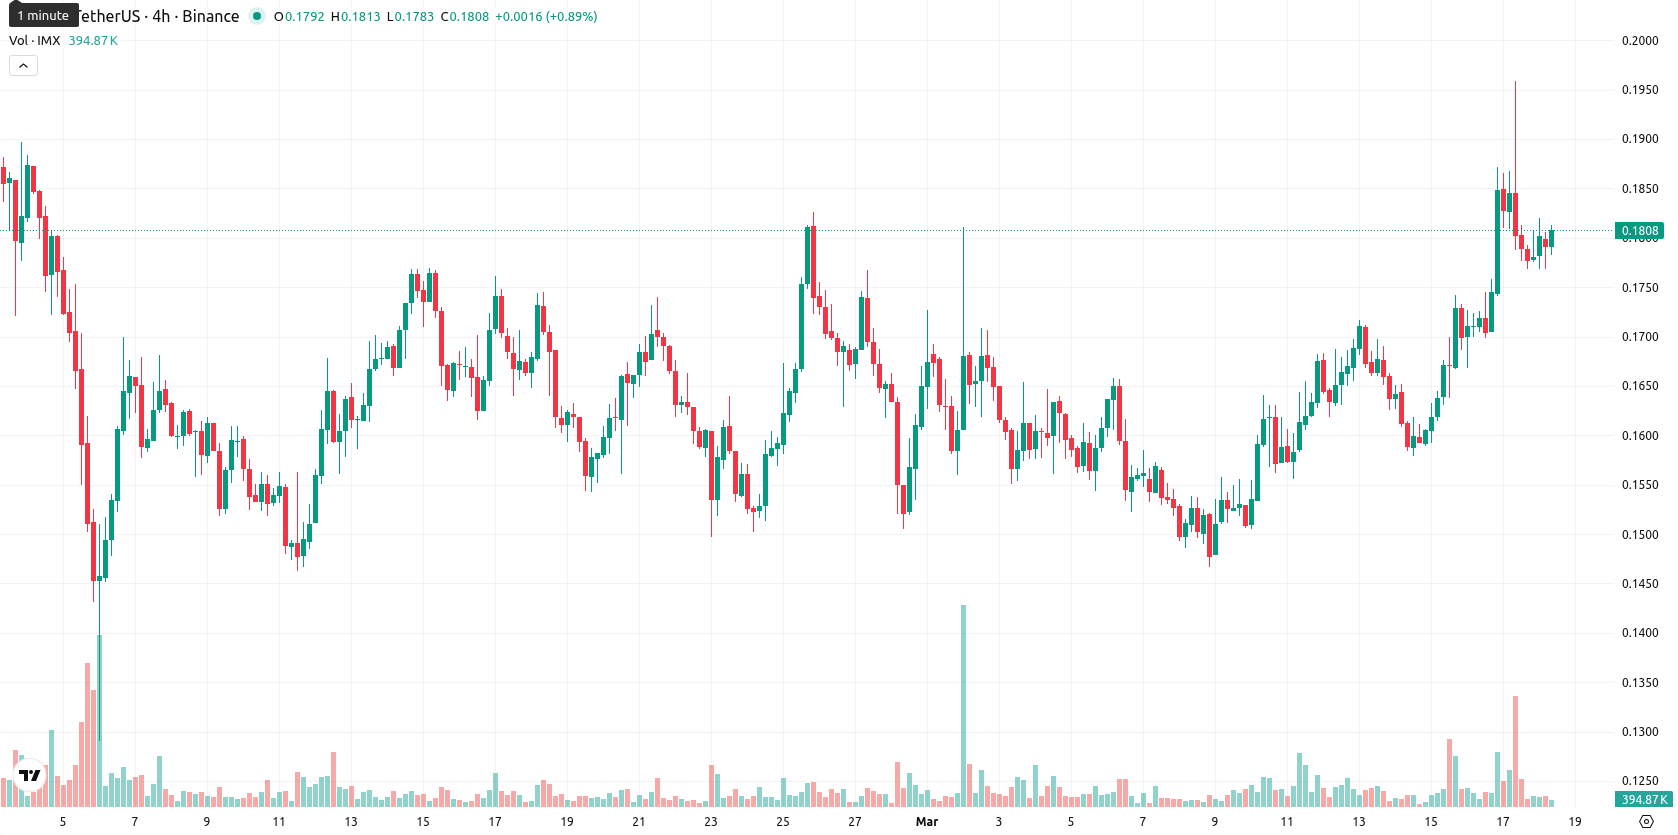
Immutable X (IMX) is trading at $0.1797, down 7.37% for the day. The asset remains above its SMA-20 ($0.1631) and SMA-50 ($0.1693), but still trades far below its SMA-200 ($0.3683), reflecting short- and medium-term strength within a challenged longer-term trend.
Highlights
- IMX shows short- and medium-term bullish momentum but remains under long-term bearish pressure below major averages.
- Momentum and oscillator signals are mixed, with intraday overbought readings and weak directional strength indicating near-term uncertainty.
- IMX is likely to trade sideways within the $0.1610–$0.1970 range over the next five sessions, with downside risk prevailing.
Bullish short-term momentum contrasted by mixed technical signals
At the current price of $0.1797, IMX is trading above both its SMA-20 ($0.1631) and SMA-50 ($0.1693), but remains far below its SMA-200 ($0.3683). This setup signals short- and medium-term bullish momentum while keeping the long-term view under pressure from earlier losses. The D1 Ichimoku Kijun is at $0.1713, which sits below the current price and therefore serves as immediate support. Momentum indicators show a mixed picture: the D1 MACD is neutral, while the D1 ADX points to weak directional strength. D1 RSI is in buy territory at 57, but Stoch RSI and CCI are both in overbought territory, suggesting short-term exhaustion. BBP is positive, indicating buyers still dominate intraday action. The Awesome Oscillator supports the bullish undertone. The day opened below the previous close, indicating a small gap down, and the price is currently mid-range for the session after a 7.37% decline. Volatility appears moderate, with some pressure after the open that aligns with the daily directional move. Divergence among oscillators and momentum indicators signals uncertainty, with intraday losses partially confirmed by short-term overbought readings.
Downside risks dominate as sideways action likely persists
Looking ahead, for the next five trading days the projected range is $0.1610 to $0.1970, normalized to fit 10% above and below the current price due to recent price action. The probability of a price increase is very low (less than 20%), making further declines more likely in the short term. Baseline scenario sees IMX trading sideways within this $0.1610 – $0.1970 corridor as mixed signals play out. A bullish scenario would require a breakout above $0.1970, establishing a new short-term high. Conversely, a bearish scenario could develop if the price breaks below $0.1610, exposing it to deeper weaknesses in line with persistent long-term and weekly bearish signals.
Earlier, analysts noted that Immutable X was positioned for sideways consolidation as short-term bullish momentum competed with persistent long-term bearish pressure. This outlook is reinforced by the latest mixed signals, highlighting a prevailing risk of further downside unless IMX can decisively hold above the $0.1610 support level in the coming sessions.


-
 Afghanistan
-
 Albania
-
 Algeria
-
 Angola
-
 Argentina
-
 Armenia
-
 Australia
-
 Austria
-
 Azerbaijan
-
 Bahamas
-
 Bahrain
-
 Bangladesh
-
 Belarus
-
 Belgium
-
 Bolivia
-
 Botswana
-
 Brazil
-
 Brunei
-
 Bulgaria
-
 Cambodia
-
 Cameroon
-
 Canada
-
 Chile
Chile
-
 China
China
-
 Colombia
-
 Congo
Congo
-
 Costa Rica
-
 Cote d'Ivoire
-
 Croatia
-
 Cuba
Cuba
-
 Cyprus
-
 Czechia
-
 DR Congo
-
 Denmark
-
 Dominican Republic
-
 Ecuador
-
 Egypt
Egypt
-
 El Salvador
-
 Estonia
-
 Eswatini
-
 Ethiopia
-
 Finland
-
 France
-
 Georgia
-
 Germany
-
 Ghana
Ghana
-
 Greece
-
 Haiti
Haiti
-
 Hong Kong
-
 Hungary
-
 India
India
-
 Indonesia
-
 Iran, Islamic republic
-
 Iraq
Iraq
-
 Ireland
-
 Israel
-
 Italy
Italy
-
 Jamaica
-
 Japan
Japan
-
 Jordan
-
 Kazakhstan
-
 Kenya
Kenya
-
 Korea
Korea
-
 Kuwait
-
 Kyrgyzstan
-
 Laos
Laos
-
 Latvia
-
 Lebanon
-
 Lesotho
-
 Libya
Libya
-
 Lithuania
-
 Luxembourg
-
 Madagascar
-
 Malaysia
-
 Malta
Malta
-
 Mauritius
-
 Mexico
-
 Moldova
-
 Mongolia
-
 Montenegro
-
 Morocco
-
 Mozambique
-
 Myanmar
-
 Namibia
-
 Nepal
Nepal
-
 Netherlands
-
 New Zealand
-
 Nigeria
-
 North Macedonia
-
 Norway
-
 Oman
Oman
-
 Pakistan
-
 Palestine
-
 Panama
-
 Papua New Guinea
-
 Paraguay
-
 Peru
Peru
-
 Philippines
-
 Poland
-
 Portugal
-
 Puerto Rico
-
 Qatar
Qatar
-
 Reunion
-
 Romania
-
 Rwanda
-
 Saudi Arabia
-
 Serbia
-
 Singapore
-
 Slovakia
-
 Slovenia
-
 Somalia
-
 South Africa
-
 Spain
Spain
-
 Sri Lanka
-
 Sweden
-
 Switzerland
-
 Syria
Syria
-
 Taiwan
-
 Tajikistan
-
 Tanzania
-
 Thailand
-
 Trinidad and Tobago
-
 Tunisia
-
 Turkey
-
 UAE
UAE
-
 Uganda
-
 Ukraine
-
 United Kingdom
-
United States
-
 Uruguay
-
 Uzbekistan
-
 Venezuela
-
 Vietnam
-
 Yemen
Yemen
-
 Zambia
-
 Zimbabwe
- Forex
- Crypto
