
Fetch.ai price prediction: Can support at $0.200 hold as FET plunges 7.55%?

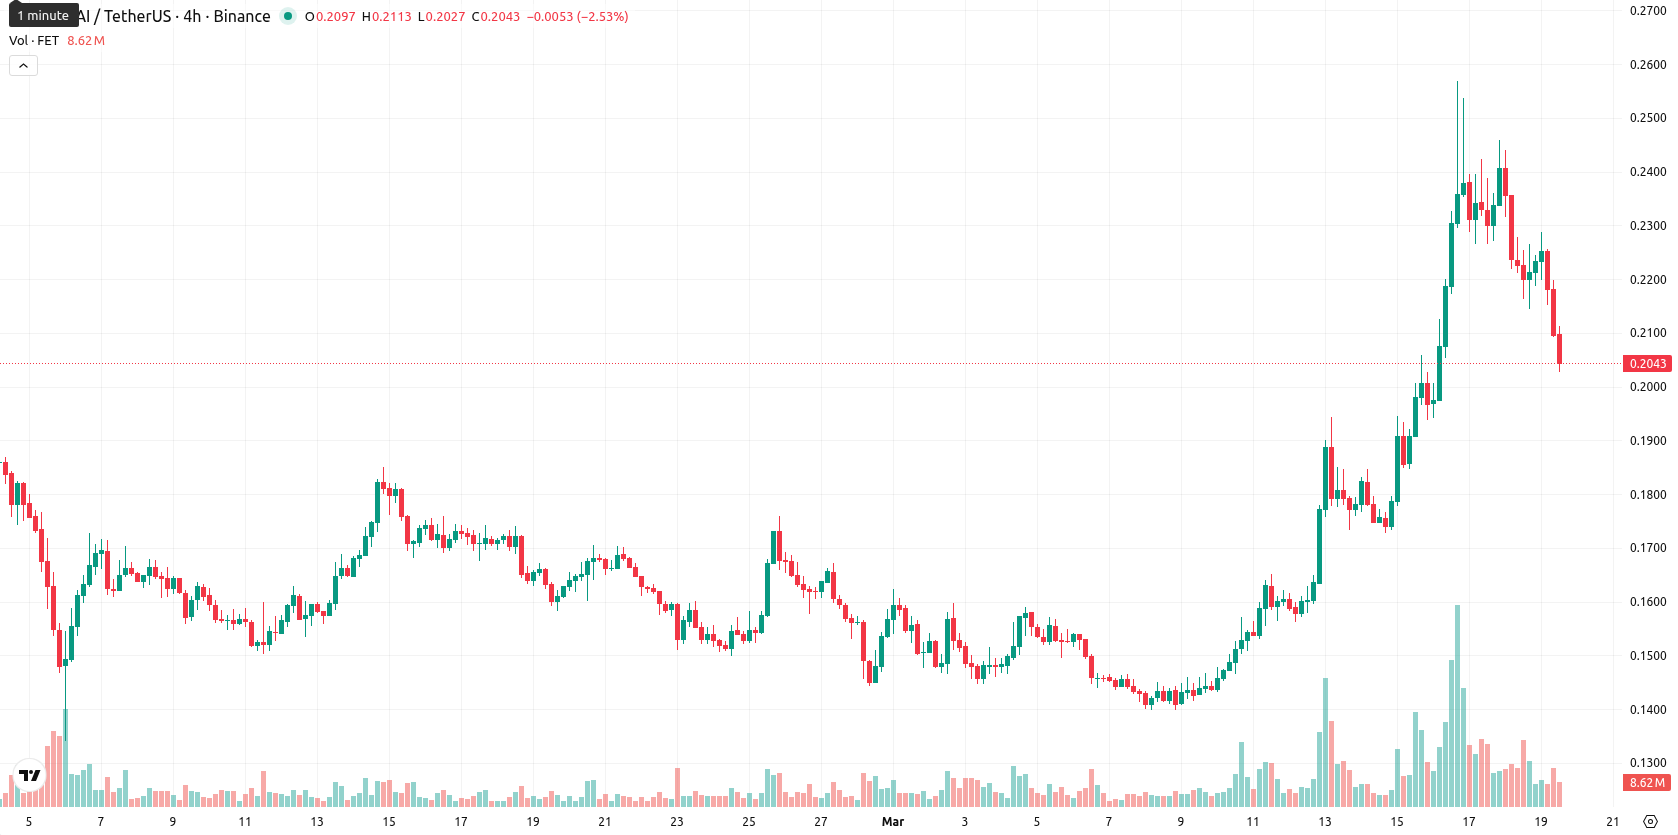
Fetch.ai (FET) is trading at $0.2034 after a 7.55% decline today. The asset remains above both the MA-20 ($0.1696) and MA-50 ($0.1710), but is still positioned below the MA-200 ($0.3082), indicating a short- and medium-term bullish trend under longer-term bearish pressure.
Highlights
- Fetch.ai maintains strong user engagement amid ongoing AI sector adoption, with elevated trading volumes signaling active profit-taking.
- Despite sector momentum, FET price action remains under sustained selling pressure, reflecting broader risk-off sentiment.
- Technical signals are mixed; FET likely trades sideways between $0.200 and $0.214, with risks skewed toward further declines absent a sustained breakout.
Profit-taking rises amid AI sector adoption and heavy selling pressure
Fetch.ai has been part of ongoing adoption trends in the AI sector, with recent on-chain data showing sustained user interest. The AI industry’s momentum was accompanied by elevated trading volumes, which pointed to increased levels of profit-taking among participants, though price action has remained under broader selling pressure.
Divergence between bullish daily signals and short-term market weakness
FET stands above the MA-20 and MA-50 but below the MA-200, confirming a short- and medium-term bullish setup contrasted by a bearish long-term outlook. The Ichimoku Kijun at $0.1984 acts as immediate support after being surpassed intraday. Momentum is mixed: MACD and ADX on the daily chart reflect buying interest, while oscillators like RSI and CCI signal overbought conditions and Stoch RSI issues a strong sell. Bull/Bear Power on D1 shows mild buyer dominance not matched at lower timeframes, and the Awesome Oscillator adds to buying tone on D1. Despite these signals, FET closed near its daily low after a 7.55% drop in a volatile session, highlighting a divergence between positive momentum and short-term sentiment.
Sideways trading favored as bullish momentum weakens
Over the next five trading days, FET is expected to move within a volatility band relative to current levels, ranging from $0.200 to $0.214. Only one out of four weekly momentum signals provides a bullish indication, suggesting less than a 20% likelihood of price appreciation and making further declines probable. The baseline scenario points to sideways action within this range. A bullish breakout would require a sustained move above Ichimoku resistance at $0.1984 and a push through $0.214, while a bearish case would see sellers drive FET below support at $0.200 toward $0.195.
Earlier, analysts noted that Fetch.ai faced persistent selling pressure despite near-term bullish signals, highlighting the risk of a corrective pullback amid sector adoption. The current analysis reinforces this cautious stance, with heightened volatility and continued overbought conditions making sustained movement above $0.214 the key hurdle for any renewed upside.


-
 Afghanistan
-
 Albania
-
 Algeria
-
 Angola
-
 Argentina
-
 Armenia
-
 Australia
-
 Austria
-
 Azerbaijan
-
 Bahamas
-
 Bahrain
-
 Bangladesh
-
 Belarus
-
 Belgium
-
 Bolivia
-
 Botswana
-
 Brazil
-
 Brunei
-
 Bulgaria
-
 Cambodia
-
 Cameroon
-
 Canada
-
 Chile
Chile
-
 China
China
-
 Colombia
-
 Congo
Congo
-
 Costa Rica
-
 Cote d'Ivoire
-
 Croatia
-
 Cuba
Cuba
-
 Cyprus
-
 Czechia
-
 DR Congo
-
 Denmark
-
 Dominican Republic
-
 Ecuador
-
 Egypt
Egypt
-
 El Salvador
-
 Estonia
-
 Eswatini
-
 Ethiopia
-
 Finland
-
 France
-
 Georgia
-
 Germany
-
 Ghana
Ghana
-
 Greece
-
 Haiti
Haiti
-
 Hong Kong
-
 Hungary
-
 India
India
-
 Indonesia
-
 Iran, Islamic republic
-
 Iraq
Iraq
-
 Ireland
-
 Israel
-
 Italy
Italy
-
 Jamaica
-
 Japan
Japan
-
 Jordan
-
 Kazakhstan
-
 Kenya
Kenya
-
 Korea
Korea
-
 Kuwait
-
 Kyrgyzstan
-
 Laos
Laos
-
 Latvia
-
 Lebanon
-
 Lesotho
-
 Libya
Libya
-
 Lithuania
-
 Luxembourg
-
 Madagascar
-
 Malaysia
-
 Malta
Malta
-
 Mauritius
-
 Mexico
-
 Moldova
-
 Mongolia
-
 Montenegro
-
 Morocco
-
 Mozambique
-
 Myanmar
-
 Namibia
-
 Nepal
Nepal
-
 Netherlands
-
 New Zealand
-
 Nigeria
-
 North Macedonia
-
 Norway
-
 Oman
Oman
-
 Pakistan
-
 Palestine
-
 Panama
-
 Papua New Guinea
-
 Paraguay
-
 Peru
Peru
-
 Philippines
-
 Poland
-
 Portugal
-
 Puerto Rico
-
 Qatar
Qatar
-
 Reunion
-
 Romania
-
 Rwanda
-
 Saudi Arabia
-
 Serbia
-
 Singapore
-
 Slovakia
-
 Slovenia
-
 Somalia
-
 South Africa
-
 Spain
Spain
-
 Sri Lanka
-
 Sweden
-
 Switzerland
-
 Syria
Syria
-
 Taiwan
-
 Tajikistan
-
 Tanzania
-
 Thailand
-
 Trinidad and Tobago
-
 Tunisia
-
 Turkey
-
 UAE
UAE
-
 Uganda
-
 Ukraine
-
 United Kingdom
-
United States
-
 Uruguay
-
 Uzbekistan
-
 Venezuela
-
 Vietnam
-
 Yemen
Yemen
-
 Zambia
-
 Zimbabwe
- Forex
- Crypto
