
Optimism slides 7.83% as bearish momentum dominates with no fresh news

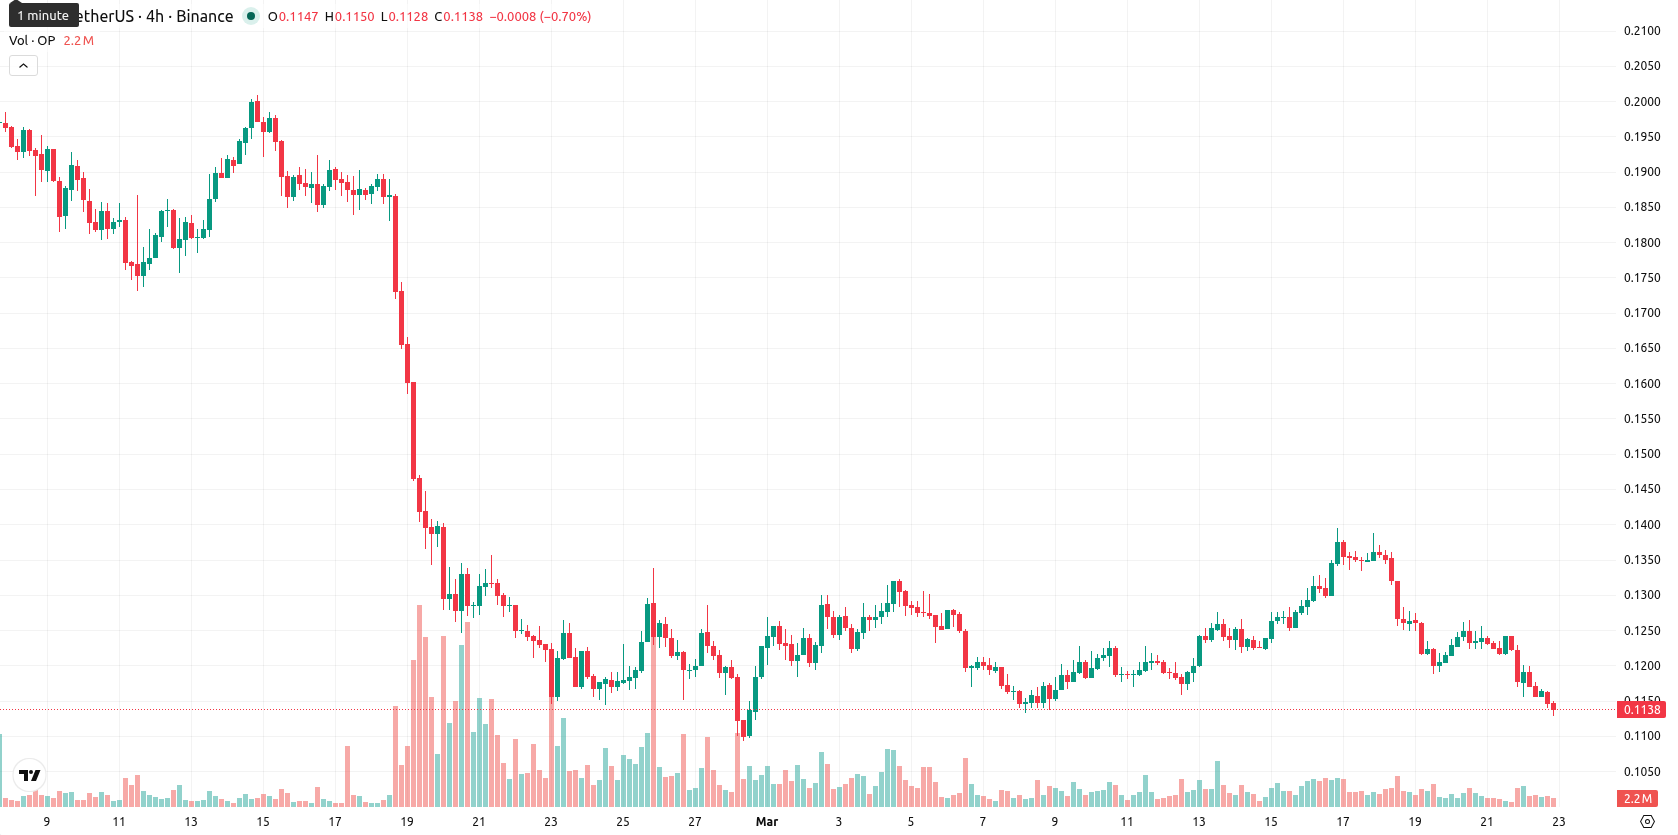
Optimism (OP) is trading at $0.113 after falling 7.83% today. The price remains well below its SMA-20 ($0.1239), SMA-50 ($0.1517), and SMA-200 ($0.3704), reflecting selling pressure across all major timeframes.
Highlights
- OP is entrenched in a strong downtrend, trading well below key moving averages across all timeframes.
- Momentum indicators confirm persistent selling pressure, with minimal signs of relief and high intraday volatility.
- OP is likely to remain rangebound between $0.102 and $0.120 over the next five days, with elevated downside risk if $0.102 fails.
Momentum weakens as sellers dominate and volatility spikes
The technical setup for OP shows the price trading beneath short, medium, and long-term moving averages, with the Ichimoku Kijun level at $0.1244 as immediate resistance. Key momentum indicators are negative: MACD and ADX confirm a strong underlying downtrend, RSI is in the sell zone on the daily chart (38.78), while Stoch RSI and CCI are neutral but close to oversold. Bull/Bear Power (BBP) signals continued dominance by sellers intraday, echoed by Awesome Oscillator (AO) neutrality with a bearish tilt. OP opened with a small gap down and maintains high intraday volatility, hovering at the bottom of its daily range ($0.1139 – $0.1201), consistent with broad momentum pressure.
Downside risk persists amid low upside probability and weak momentum
Over the next five trading days, the typical volatility band for OP is expected to span $0.102 to $0.120, with the probability of an upward move remaining below 20%. Sideways trading within this range is most likely while oversold signals slow the pace of further decline. A sustained move above the $0.124 resistance could prompt a relief bounce; conversely, falling below $0.102 may accelerate downside momentum with minimal nearby support. The technical outlook continues to favor further losses under persistent weak momentum.
Earlier, analysts noted that Optimism continued to face persistent selling pressure with no clear signs of a bullish reversal. This latest analysis reinforces the bearish outlook, highlighting that downside risk remains elevated while a move below $0.102 could prompt further weakness in the near term.


Latest Optimism News


-
 Afghanistan
-
 Albania
-
 Algeria
-
 Angola
-
 Argentina
-
 Armenia
-
 Australia
-
 Austria
-
 Azerbaijan
-
 Bahamas
-
 Bahrain
-
 Bangladesh
-
 Belarus
-
 Belgium
-
 Bolivia
-
 Botswana
-
 Brazil
-
 Brunei
-
 Bulgaria
-
 Cambodia
-
 Cameroon
-
 Canada
-
 Chile
Chile
-
 China
China
-
 Colombia
-
 Congo
Congo
-
 Costa Rica
-
 Cote d'Ivoire
-
 Croatia
-
 Cuba
Cuba
-
 Cyprus
-
 Czechia
-
 DR Congo
-
 Denmark
-
 Dominican Republic
-
 Ecuador
-
 Egypt
Egypt
-
 El Salvador
-
 Estonia
-
 Eswatini
-
 Ethiopia
-
 Finland
-
 France
-
 Georgia
-
 Germany
-
 Ghana
Ghana
-
 Greece
-
 Haiti
Haiti
-
 Hong Kong
-
 Hungary
-
 India
India
-
 Indonesia
-
 Iran, Islamic republic
-
 Iraq
Iraq
-
 Ireland
-
 Israel
-
 Italy
Italy
-
 Jamaica
-
 Japan
Japan
-
 Jordan
-
 Kazakhstan
-
 Kenya
Kenya
-
 Korea
Korea
-
 Kuwait
-
 Kyrgyzstan
-
 Laos
Laos
-
 Latvia
-
 Lebanon
-
 Lesotho
-
 Libya
Libya
-
 Lithuania
-
 Luxembourg
-
 Madagascar
-
 Malaysia
-
 Malta
Malta
-
 Mauritius
-
 Mexico
-
 Moldova
-
 Mongolia
-
 Montenegro
-
 Morocco
-
 Mozambique
-
 Myanmar
-
 Namibia
-
 Nepal
Nepal
-
 Netherlands
-
 New Zealand
-
 Nigeria
-
 North Macedonia
-
 Norway
-
 Oman
Oman
-
 Pakistan
-
 Palestine
-
 Panama
-
 Papua New Guinea
-
 Paraguay
-
 Peru
Peru
-
 Philippines
-
 Poland
-
 Portugal
-
 Puerto Rico
-
 Qatar
Qatar
-
 Reunion
-
 Romania
-
 Rwanda
-
 Saudi Arabia
-
 Serbia
-
 Singapore
-
 Slovakia
-
 Slovenia
-
 Somalia
-
 South Africa
-
 Spain
Spain
-
 Sri Lanka
-
 Sweden
-
 Switzerland
-
 Syria
Syria
-
 Taiwan
-
 Tajikistan
-
 Tanzania
-
 Thailand
-
 Trinidad and Tobago
-
 Tunisia
-
 Turkey
-
 UAE
UAE
-
 Uganda
-
 Ukraine
-
 United Kingdom
-
United States
-
 Uruguay
-
 Uzbekistan
-
 Venezuela
-
 Vietnam
-
 Yemen
Yemen
-
 Zambia
-
 Zimbabwe
- Forex
- Crypto
