
XRP price prediction: Will $1.30–$1.33 hold as XRP drops 2.71%

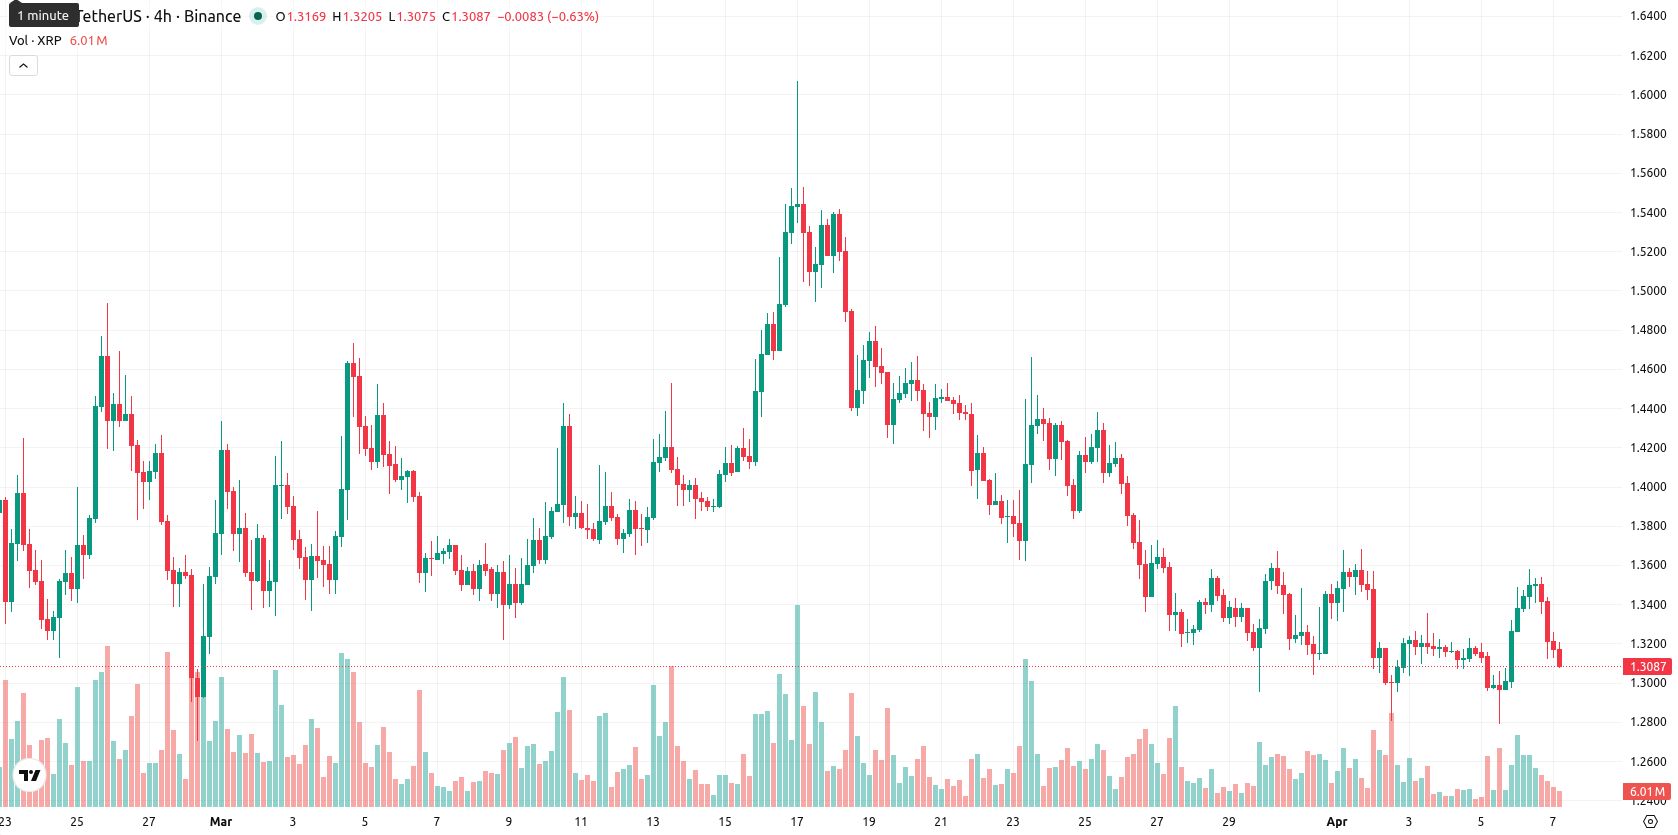
XRP (XRP) is trading at $1.3088, having dropped $0.0365 (-2.71%) on the day and remaining below the SMA-20 ($1.3686), SMA-50 ($1.3903), and SMA-200 ($1.9833), all indicating persistent bearish pressure across multiple timeframes.
Highlights
- The SEC's proposed Regulation Crypto Assets has reached White House review, advancing regulatory clarity for crypto fundraising and safe harbor provisions.
- XRP’s classification as a commodity in March 2026 removed key legal barriers, spurring $1.2 billion in ETF inflows, though institutional adoption remains limited.
- XRP trades under significant bearish pressure, with technical indicators favoring a downside bias and a likely consolidation between $1.30 and $1.33 over the next week.
Legal clarity and low liquidity as SEC review tempers institutional demand
The US Securities and Exchange Commission's proposed Regulation Crypto Assets (Reg Crypto), which introduces a new crypto fundraising framework and safe harbor, has entered the White House regulatory review stage. SEC guidance issued in March 2026 classified XRP as a commodity, removing a key legal uncertainty for institutional adoption. Liquidity on major exchanges has reached record lows and inflows into XRP-related ETFs surpassed $1.2 billion by January but have since stalled, with institutional participation remaining subdued and ETF assets held predominantly by retail investors.
Bearish momentum builds as resistance and oversold signals converge
Technically, XRP faces pressure below immediate resistance at the Ichimoku Kijun level of $1.4429, with all key moving averages (SMA-20, SMA-50, SMA-200) trending above the current price and confirming a bearish setup. Weak momentum is shown by bearish MACD and ADX readings, while both RSI and CCI remain in 'Sell' territory and Stoch RSI points to an oversold environment. Bull/Bear Power (BBP) suggests a minor potential for buyer interest, but prevailing selling pressure is signaled by oscillators and the Awesome Oscillator, in line with the continuing downtrend. The asset opened with a slight gap lower and is trading near today's range low, under low intraday volatility.
Limited upside seen as narrow trading range and weak sentiment persist
Over the next five trading days, the typical volatility band for XRP is expected between $1.30 and $1.33, based on current subdued price action. Persistent bearish signals on the daily and weekly timeframes indicate less than a 20% chance of a price increase, favoring further declines. The baseline scenario anticipates XRP moving sideways within the $1.30 to $1.33 corridor. Should a bullish reversal occur, a move above $1.44 is required, while a drop below $1.30 could trigger additional downside toward lower support.
Earlier, analysts noted a resurgence in XRP whale accumulation and renewed optimism tied to key ecosystem events in Asia. Recent developments, however, highlight persistent bearish pressure and subdued institutional participation, making sustained sideways movement within the $1.30–$1.33 range the prevailing scenario to monitor in the short term.


-
 Afghanistan
-
 Albania
-
 Algeria
-
 Angola
-
 Argentina
-
 Armenia
-
 Australia
-
 Austria
-
 Azerbaijan
-
 Bahamas
-
 Bahrain
-
 Bangladesh
-
 Belarus
-
 Belgium
-
 Bolivia
-
 Botswana
-
 Brazil
-
 Brunei
-
 Bulgaria
-
 Cambodia
-
 Cameroon
-
 Canada
-
 Chile
Chile
-
 China
China
-
 Colombia
-
 Congo
Congo
-
 Costa Rica
-
 Cote d'Ivoire
-
 Croatia
-
 Cuba
Cuba
-
 Cyprus
-
 Czechia
-
 DR Congo
-
 Denmark
-
 Dominican Republic
-
 Ecuador
-
 Egypt
Egypt
-
 El Salvador
-
 Estonia
-
 Eswatini
-
 Ethiopia
-
 Finland
-
 France
-
 Georgia
-
 Germany
-
 Ghana
Ghana
-
 Greece
-
 Haiti
Haiti
-
 Hong Kong
-
 Hungary
-
 India
India
-
 Indonesia
-
 Iran, Islamic republic
-
 Iraq
Iraq
-
 Ireland
-
 Israel
-
 Italy
Italy
-
 Jamaica
-
 Japan
Japan
-
 Jordan
-
 Kazakhstan
-
 Kenya
Kenya
-
 Korea
Korea
-
 Kuwait
-
 Kyrgyzstan
-
 Laos
Laos
-
 Latvia
-
 Lebanon
-
 Lesotho
-
 Libya
Libya
-
 Lithuania
-
 Luxembourg
-
 Madagascar
-
 Malaysia
-
 Malta
Malta
-
 Mauritius
-
 Mexico
-
 Moldova
-
 Mongolia
-
 Montenegro
-
 Morocco
-
 Mozambique
-
 Myanmar
-
 Namibia
-
 Nepal
Nepal
-
 Netherlands
-
 New Zealand
-
 Nigeria
-
 North Macedonia
-
 Norway
-
 Oman
Oman
-
 Pakistan
-
 Palestine
-
 Panama
-
 Papua New Guinea
-
 Paraguay
-
 Peru
Peru
-
 Philippines
-
 Poland
-
 Portugal
-
 Puerto Rico
-
 Qatar
Qatar
-
 Reunion
-
 Romania
-
 Rwanda
-
 Saudi Arabia
-
 Serbia
-
 Singapore
-
 Slovakia
-
 Slovenia
-
 Somalia
-
 South Africa
-
 Spain
Spain
-
 Sri Lanka
-
 Sweden
-
 Switzerland
-
 Syria
Syria
-
 Taiwan
-
 Tajikistan
-
 Tanzania
-
 Thailand
-
 Trinidad and Tobago
-
 Tunisia
-
 Turkey
-
 UAE
UAE
-
 Uganda
-
 Ukraine
-
 United Kingdom
-
United States
-
 Uruguay
-
 Uzbekistan
-
 Venezuela
-
 Vietnam
-
 Yemen
Yemen
-
 Zambia
-
 Zimbabwe
- Forex
- Crypto
