
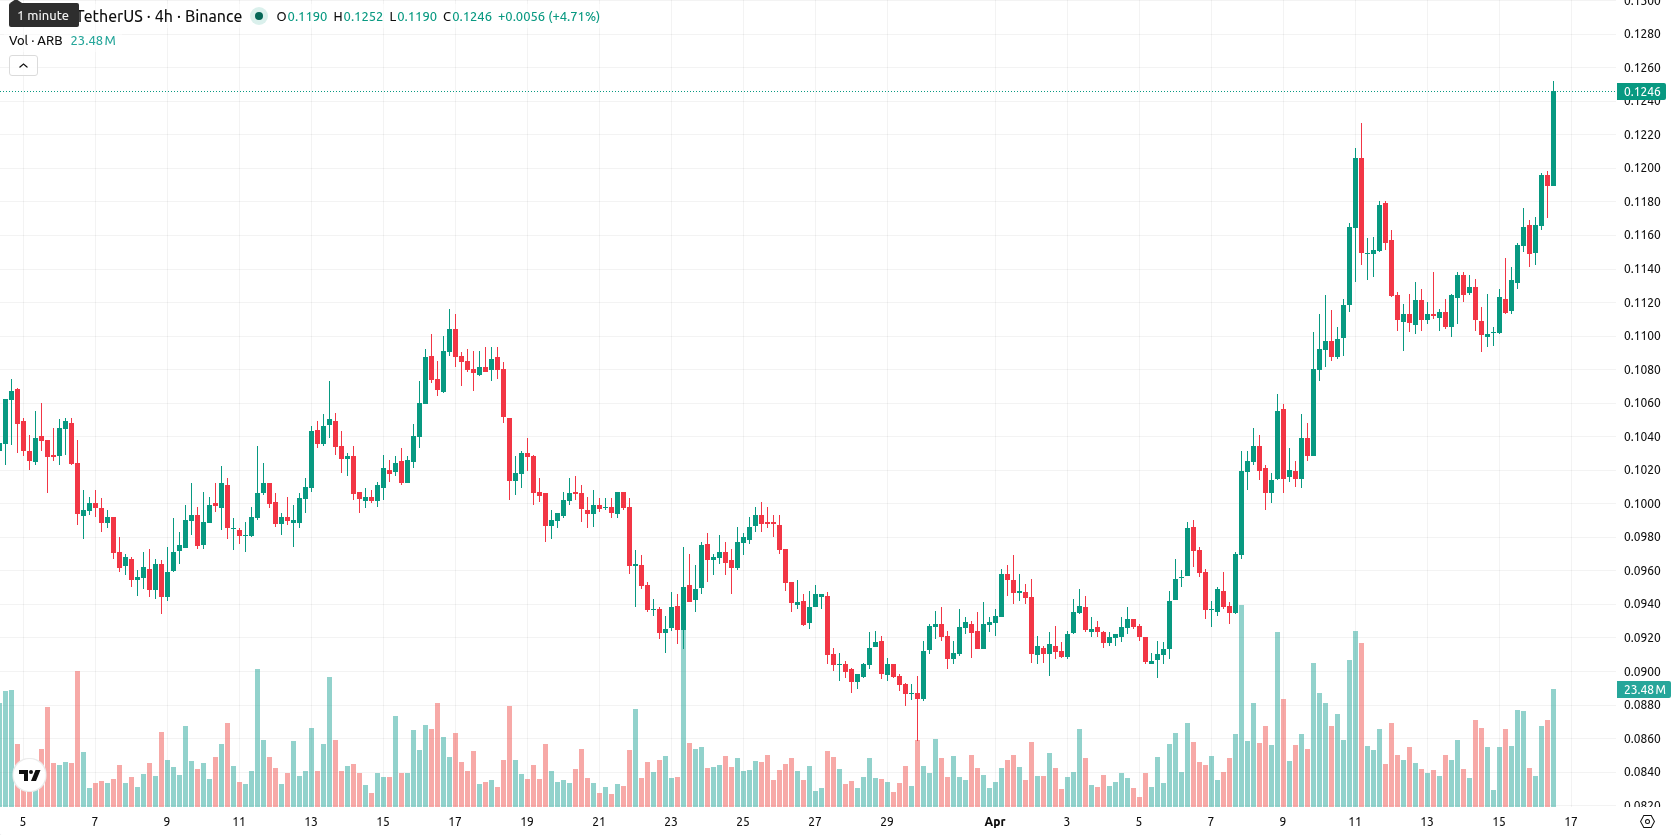
+9.60% for Arbitrum as market pushes above recent price lows

Arbitrum (ARB) is trading at $0.1244, up 9.6% today, sitting above the SMA-20 ($0.1004) and SMA-50 ($0.1003), but well below the SMA-200 ($0.1975). This configuration highlights a short- and medium-term bullish structure for ARB, while the longer-term outlook remains bearish, with the Ichimoku Kijun at $0.1044 providing immediate support.
Highlights
- ARB maintains a short- and medium-term bullish trend but remains in a longer-term bearish structure below major averages.
- Momentum signals are turning overbought, with indicators showing buyer dominance but elevated risk of exhaustion near current highs.
- For the next five sessions, ARB is likely to trade sideways between $0.1150 and $0.1330; probability of further breakout remains low.
Upside momentum persists as overbought risks build
Momentum indicators remain constructive: the daily MACD is on a buy signal, the ADX reads 18.4 (neutral and low strength), and the RSI is approaching the upper bound at 63.9. The CCI is in overbought territory and Stoch RSI is elevated, indicating some risk of exhaustion, while BBP highlights ongoing buyer dominance. No open gaps are observed, today’s session began at $0.1166 after a $0.1135 close, with the current price above today’s high-range, reflecting elevated volatility and strong upside sentiment post-open. Intraday momentum mostly supports the gains, though slightly overbought oscillators suggest caution near short-term highs.
Limited upside as breakout and support tests define path
For the next five trading days, the expected range for ARB lies between $0.1150 and $0.1330, in line with typical volatility near current levels. The probability of further price increases is low (under 20%), suggesting a likely pullback or sideways trading. The baseline scenario envisions ARB holding steady in a sideways corridor. A move above $0.1330 on sustained momentum would trigger a bullish breakout, while a decline below $0.1150 would confirm a rejection of support and open further downside.
Earlier, analysts noted that Arbitrum was exhibiting short- to medium-term bullish momentum while remaining structurally bearish over the longer term. The latest price action and indicator signals reinforce this perspective, with current conditions supporting a sideways-to-lower bias unless ARB can sustain a breakout above $0.1330.


-
 Afghanistan
-
 Albania
-
 Algeria
-
 Angola
-
 Argentina
-
 Armenia
-
 Australia
-
 Austria
-
 Azerbaijan
-
 Bahamas
-
 Bahrain
-
 Bangladesh
-
 Belarus
-
 Belgium
-
 Bolivia
-
 Botswana
-
 Brazil
-
 Brunei
-
 Bulgaria
-
 Cambodia
-
 Cameroon
-
 Canada
-
 Chile
Chile
-
 China
China
-
 Colombia
-
 Congo
Congo
-
 Costa Rica
-
 Cote d'Ivoire
-
 Croatia
-
 Cuba
Cuba
-
 Cyprus
-
 Czechia
-
 DR Congo
-
 Denmark
-
 Dominican Republic
-
 Ecuador
-
 Egypt
Egypt
-
 El Salvador
-
 Estonia
-
 Eswatini
-
 Ethiopia
-
 Finland
-
 France
-
 Georgia
-
 Germany
-
 Ghana
Ghana
-
 Greece
-
 Haiti
Haiti
-
 Hong Kong
-
 Hungary
-
 India
India
-
 Indonesia
-
 Iran, Islamic republic
-
 Iraq
Iraq
-
 Ireland
-
 Israel
-
 Italy
Italy
-
 Jamaica
-
 Japan
Japan
-
 Jordan
-
 Kazakhstan
-
 Kenya
Kenya
-
 Korea
Korea
-
 Kuwait
-
 Kyrgyzstan
-
 Laos
Laos
-
 Latvia
-
 Lebanon
-
 Lesotho
-
 Libya
Libya
-
 Lithuania
-
 Luxembourg
-
 Madagascar
-
 Malaysia
-
 Malta
Malta
-
 Mauritius
-
 Mexico
-
 Moldova
-
 Mongolia
-
 Montenegro
-
 Morocco
-
 Mozambique
-
 Myanmar
-
 Namibia
-
 Nepal
Nepal
-
 Netherlands
-
 New Zealand
-
 Nigeria
-
 North Macedonia
-
 Norway
-
 Oman
Oman
-
 Pakistan
-
 Palestine
-
 Panama
-
 Papua New Guinea
-
 Paraguay
-
 Peru
Peru
-
 Philippines
-
 Poland
-
 Portugal
-
 Puerto Rico
-
 Qatar
Qatar
-
 Reunion
-
 Romania
-
 Rwanda
-
 Saudi Arabia
-
 Serbia
-
 Singapore
-
 Slovakia
-
 Slovenia
-
 Somalia
-
 South Africa
-
 Spain
Spain
-
 Sri Lanka
-
 Sweden
-
 Switzerland
-
 Syria
Syria
-
 Taiwan
-
 Tajikistan
-
 Tanzania
-
 Thailand
-
 Trinidad and Tobago
-
 Tunisia
-
 Turkey
-
 UAE
UAE
-
 Uganda
-
 Ukraine
-
 United Kingdom
-
United States
-
 Uruguay
-
 Uzbekistan
-
 Venezuela
-
 Vietnam
-
 Yemen
Yemen
-
 Zambia
-
 Zimbabwe
- Forex
- Crypto
